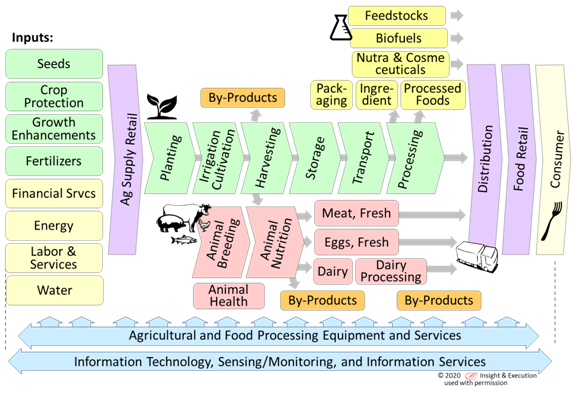
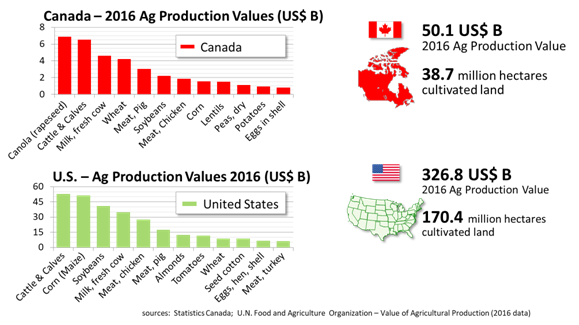
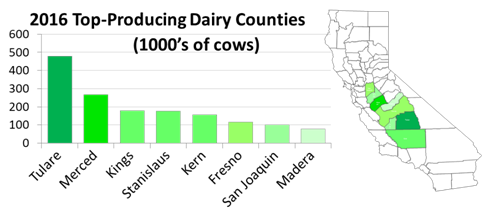
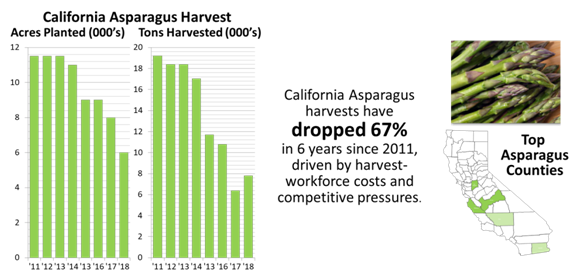
Tell a Compelling, Data-Driven Story about your Business - Part 1 - GLOBAL VALUE CHAIN SEGMENTS4/2/2020 For many Ag-&-Food entrepreneurs, telling a compelling story about the magnitude of their innovation, and the size of the value chain segments they can transform, is essential to their ability to recruit investment, talent, and partners or collaborators in pursuing their innovation. In a data-driven world, there is no substitute for doing the homework to help paint a comprehensive picture. Fortunately, there is a wealth of free data sources available on our global Ag-&-Food ecosystem that entrepreneurs and innovators can use to help quantify the magnitude of their innovation. This article summarizes a few of these sources that entrepreneurs can utilize to build a comprehensive picture of the value chain segments relevant to their unique business ambitions. The Global Food Value Chain Our world’s food system represents one of the most extensive global value chains, feeding nearly 8 billion people on a daily basis. Within this value chain, many existing suppliers, retailers, growers, producers, processors and service providers participate and contribute value at multiple points, representing multiple trillions of dollars of annual production, processing, and consumption. Innovation in agriculture and food technologies offers the promise of transforming the productivity, efficiency, nutritional value and sustainability of individual segments of this value chain. Countless opportunities exist throughout this complex value chain where innovators and entrepreneurs can offer unique solutions. For an entrepreneur to tell a compelling story about their specific innovation, it’s important to be able to relate how their innovation fits in a larger value chain - who are their customers, who are their suppliers, and what existing providers would they be assisting or displacing as a result of their innovation? Putting magnitudes on the size of these value chain segments is a first step, but also important considerations are developing trends, over what timeframes, geographies and other segmentation. Global Ag-&-Food Data The comprehensive source for globally-comparable data across countries or regions is the United Nations Food and Agriculture Organization (UN FAO). The UN FAO offers an ‘FAO STAT’ interface on their FAOSTAT website (http://www.fao.org/faostat/en/#data) that offers comprehensive searchable data and statistics on animal and crop production (quantity), value of agricultural production, volume of inputs (fertilizer and pesticide use), land area, commodity pricing, imports and exports by country, etc. over a range of timelines. The data sets are updated annually with the most-recent comprehensive data available through 2016. Anyone can access the information and select from a range of factors to customize the domain and range of data, geographies, and timeline to align with the specific question of interest, and the information can easily be downloaded from the site in spreadsheet form for further analysis and presentation. Examples of the types of UN FAO information that can be extracted are shown below: EU Ag-&-Food Data At a more-regional level, crop production information can be extracted from regional governmental organizations such as EuroStat (https://ec.europa.eu/eurostat/data/database), with data on production and trade by crop, geography, with values in production quantity, value, area, and yield), and with data from as recent as the 2019 crop year. The extensive EuroStat database can be navigated through a unique click-through navigation tree to identify the specific domain of interest (e.g., ‘Agriculture, Forestry, and Fisheries’), and then the user can open a Data Explorer to select the specific data values, geographies, and timescales of interest. Extensive data on organic production and other themes is also available. US Ag-&-Food Data For United States data, a comprehensive picture can be extracted from the US Department of Agriculture (USDA) Quickstats database (https://quickstats.nass.usda.gov/), with data available on animal and crop production quantity, value, acreage, chemical and fertilizer use, and a variety of other data values, by geography, state, and even county levels, for crop years as current as 2017 and 2018. The QuickStats data-selection interface is relatively intuitive, allowing the user to select the specific data fields, and showing additional data fields as relevant to what the user has already selected. (For example, some data is only available on a periodic ‘sampled’ basis. For comprehensive data, select ‘Census’ rather than ‘Survey’). For example, sometimes county-level data is available for specific data values, and for other selected data fields, it is not. Data values can be as recent as the 2019 crop year for some selected data values, while for others, data is available only through 2018 or 2017. When selecting data by state or county, the user can select the specific state, states, or counties of interest, or simply let QuickStats return all of the available data for that specific selection to identify which states/geographies are relevant. QuickStats data can easily be downloaded from the web interface in spreadsheet form for further refinement or analysis. Examples of the kinds of data that are available through QuickStats include the following: Often, more-specific information on individual states or commodities, including export and trade values, can be found on individual state agriculture department websites, such as the California Department of Food and Agriculture (CDFA) website (https://www.cdfa.ca.gov/statistics/). The CDFA site includes comprehensive reports by crop year with extensive information by crop and county-level data going back many decades, but the information is published in a static form that often requires manual effort to tabulate and correlate into time series. Fortunately, much of this state and county-level data is available from the USDA QuickStats site in a more searchable form. Trade Association Data Information on specific food-industry topics can also often be found by looking at websites of specific commodity or industry-associations, that provide public information and advocate for their particular agricultural commodity or industry segment. For example, the Plant-Based Foods Association (https://plantbasedfoods.org/) has a wealth of information on consumers (https://plantbasedfoods.org/marketplace/consumer-insights/), and industry sales trends (https://plantbasedfoods.org/marketplace/retail-sales-data/) that can be leveraged to educate audiences and investors about trends relevant to entrepreneurs in those industry segments. Commodity Board Data Many individual crop commodities in the country and in California have a state-chartered commodity board advocating on behalf of that commodity, and making public information available on their crop as part of their advocacy. For example, an excellent example of this is the California Almond Board, which publishes a wealth of statistical information on their website (https://www.almonds.com/growers/resources/almond-almanac-industry-stats), covering production, farms, acreage, inventories, exports and trade, as well as sustainability topics and industry marketing efforts globally. Annual almanacs going back several years are available, for constructing time-series data. With such a wealth of data available, innovators and entrepreneurs should take advantage of these resources. A few hours spent to capture and represent the most up-to-date information on their industry or value-chain segment, and how their innovation might save costs, improve efficiency, reduce inputs or improve sustainability, would be well-spent to enable entrepreneurs to present their businesses as knowledgeably and professionally as they can to prospective customers, partners, employees, and investors. About the Author: John Selep is the Co-Founder and President of the AgTech Innovation Alliance, the 501(c)3 non-profit behind AgStart.
1 Comment
|
Archives
May 2021
Categories |


 RSS Feed