|
WOODLAND, Calif. (May 27, 2021) – With a thriving food and agricultural economy valued at more than $12 billion, the Greater Sacramento region elevated its capabilities as a global leader in Ag, Food and Health innovation with the launch of operations at The Lab@AgStart this week. The Lab@Agstart includes the Yocha Dehe Lab and the Raley’s Food Lab, which will provide a place for entrepreneurs and innovators to cultivate Ag, Food and Health innovation from concept to commercialization. The Downtown Woodland facility is the only lab of its kind in Northern California to include a shared wet lab, food lab and co-working space.
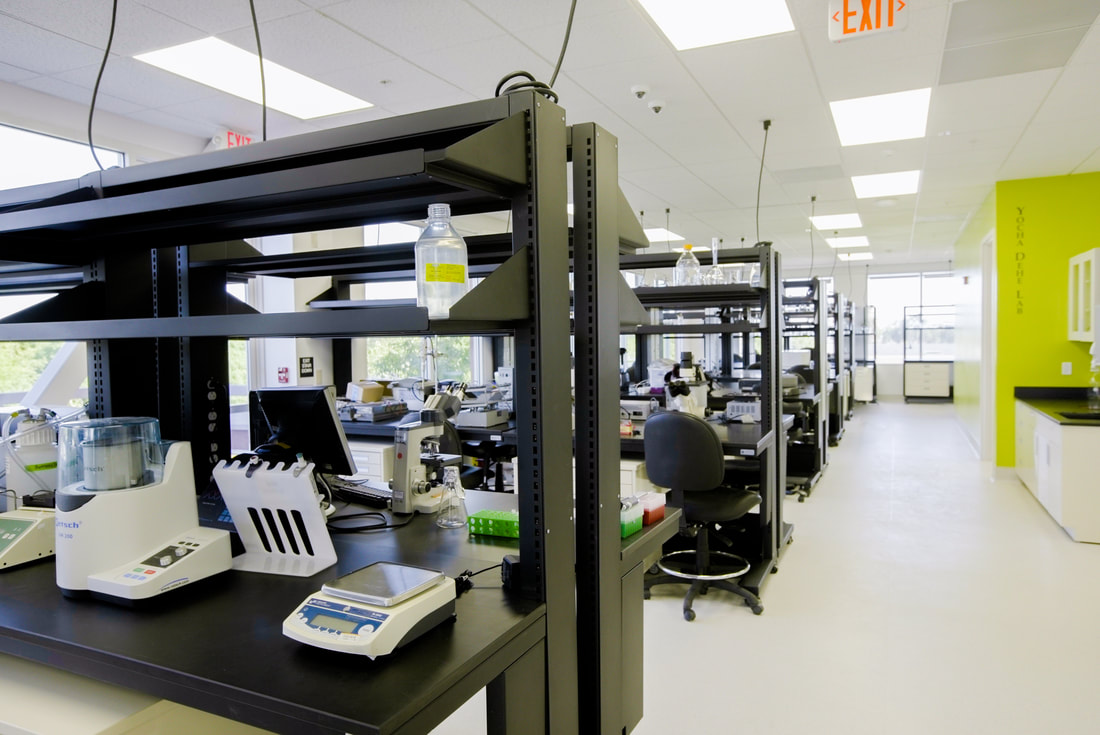
The Lab@AgStart represents a unique public-private partnership that came together to fund the $1.5 million wet and food innovation lab space, creating a shared-use incubator for innovators and entrepreneurs in the Ag, Food and Health industries. The 4,800 square foot space in Woodland was made possible through support from multiple public and private organizations, including the U.S. Economic Development Administration, the State of California’s iBank, the County of Yolo and the City of Woodland, as well as private support and sponsorships from the Yocha Dehe Wintun Nation, Raley’s, First Northern Bank, Bayer, Syngenta and many others. The Yocha Dehe Lab is one of only four wet labs in the region focused on supporting startup companies. The Bio-Safety Level 1 facility will address the immense demand for wet lab space for start-ups by adding 2,500 sq.ft. of wet chemistry laboratory space and capacity for 28 dedicated laboratory benches. The Raley’s Food Lab is a certified food facility where innovators can develop new food products, ingredients, and recipes for taste testing, sampling and small-volume sales. The facility is fully outfitted with kitchen and food preparation equipment and will be reservable for use by established and aspiring food entrepreneurs. It is the only food lab of its kind in Northern California, making it ideal for food entrepreneurs to experiment and test new foods and food ingredients in a region renowned for its vibrant agriculture and food innovation ecosystem. The facility will also provide co-working space for lab users and other entrepreneurs to conduct meetings, phone or video conferences, as well as a place to convene over a coffee in the break area, in order to build a community of creative collaborations among fellow entrepreneurs. The conference room was named the First Northern Bank Board Room to recognize the financial institution’s contributions to the space. The Lab@AgStart is located at 1100 Main Street in Downtown Woodland, Yolo County – the heart of one of California’s centers for specialty crop production and processing. Woodland is home to over 180 food and ag businesses and is a short drive from University of California, Davis (UC Davis), one of the top global academic institutions in agtech, foodtech and food-for-health innovation. UC Davis received $941 million in external research funding in 2019-20 to support critical work ranging from new online platforms to climate change to the study of grapevine red blotch disease. The college of Agricultural and Environmental Sciences alone received an increase of $29 million from the previous year. The Lab@AgStart is a key initiative of Our Path Forward: The Prosperity Strategy and the region’s Comprehensive Economic Development Strategy – a strategic framework and bridge to action for the six-county Sacramento Region that prioritizes core economic initiatives including the ability to leverage key clusters, research institutions and innovation in order to create a more inclusive economy.
2 Comments
WOODLAND, California (February 3rd, 2021) – AgStart announced today that Raley’s, the family-owned regional grocery chain, will sponsor the Raley’s Food Lab at The Lab@AgStart incubator in Woodland, California.
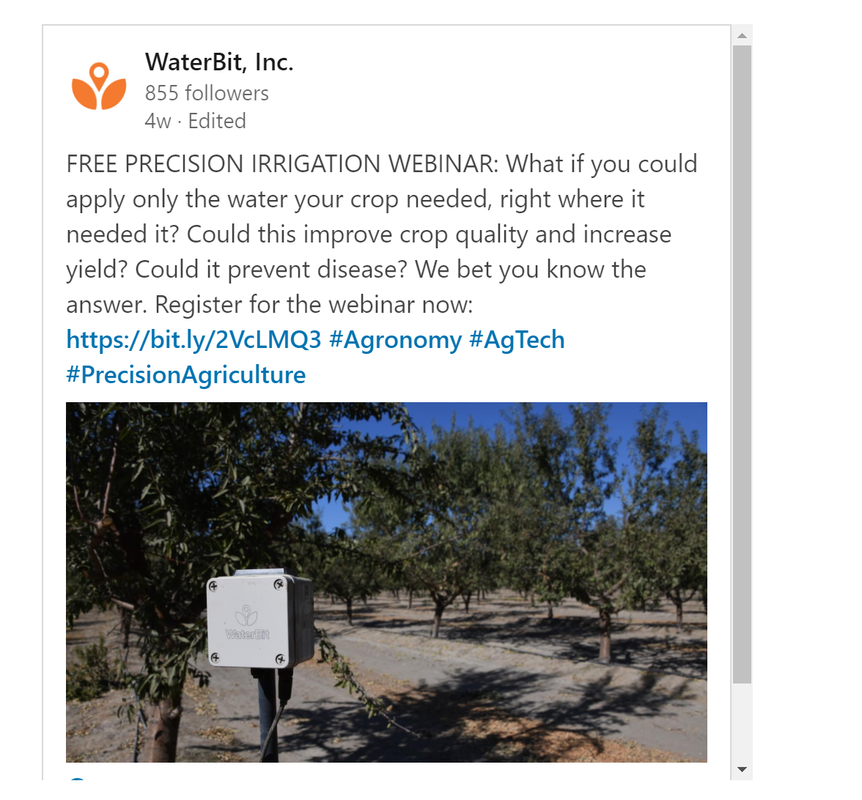
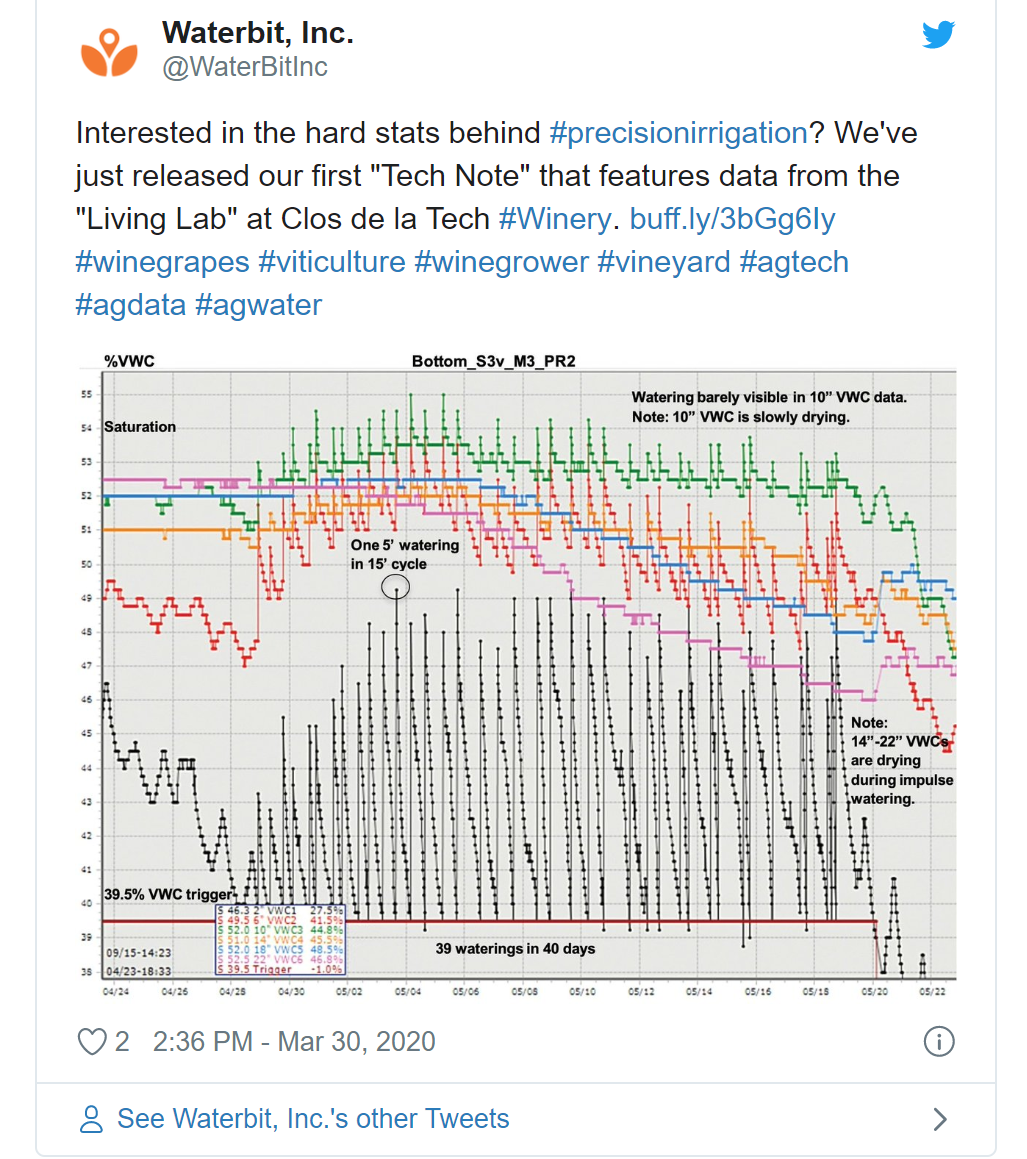
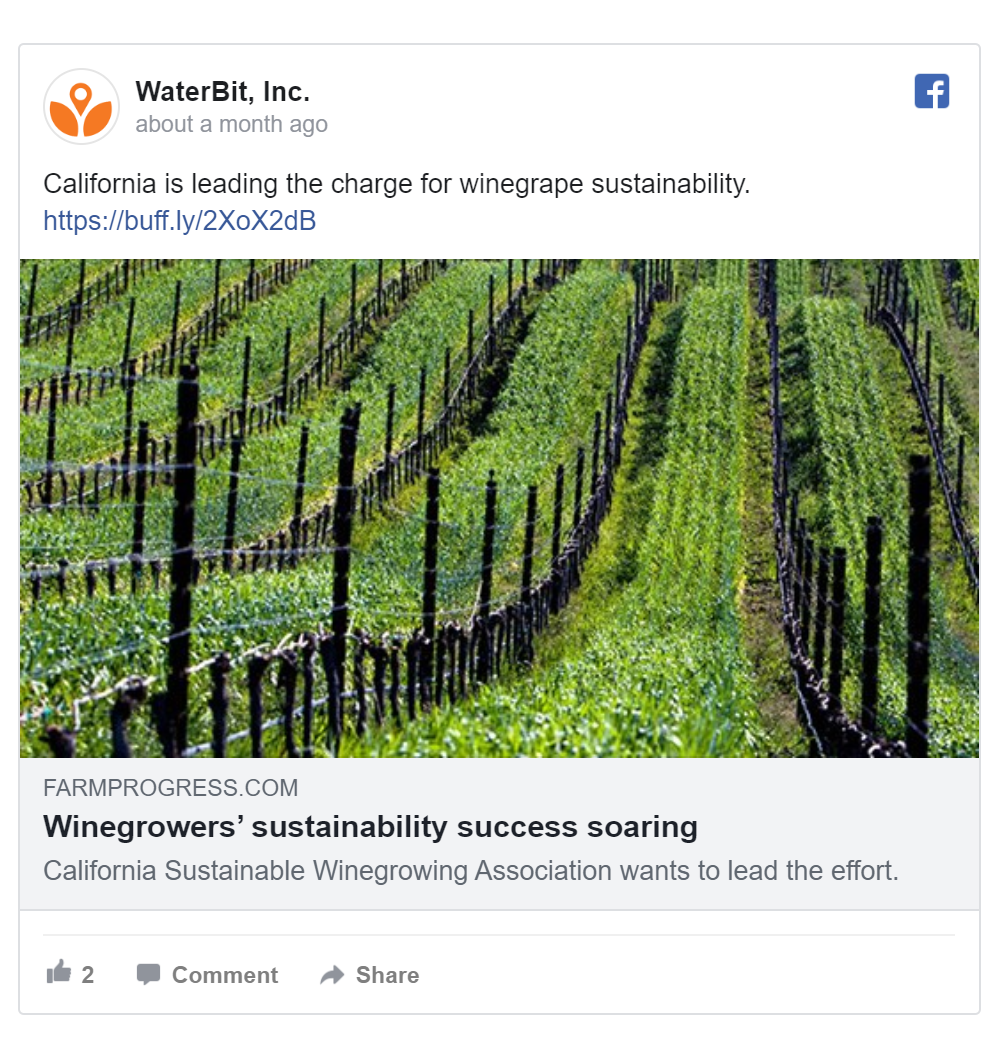
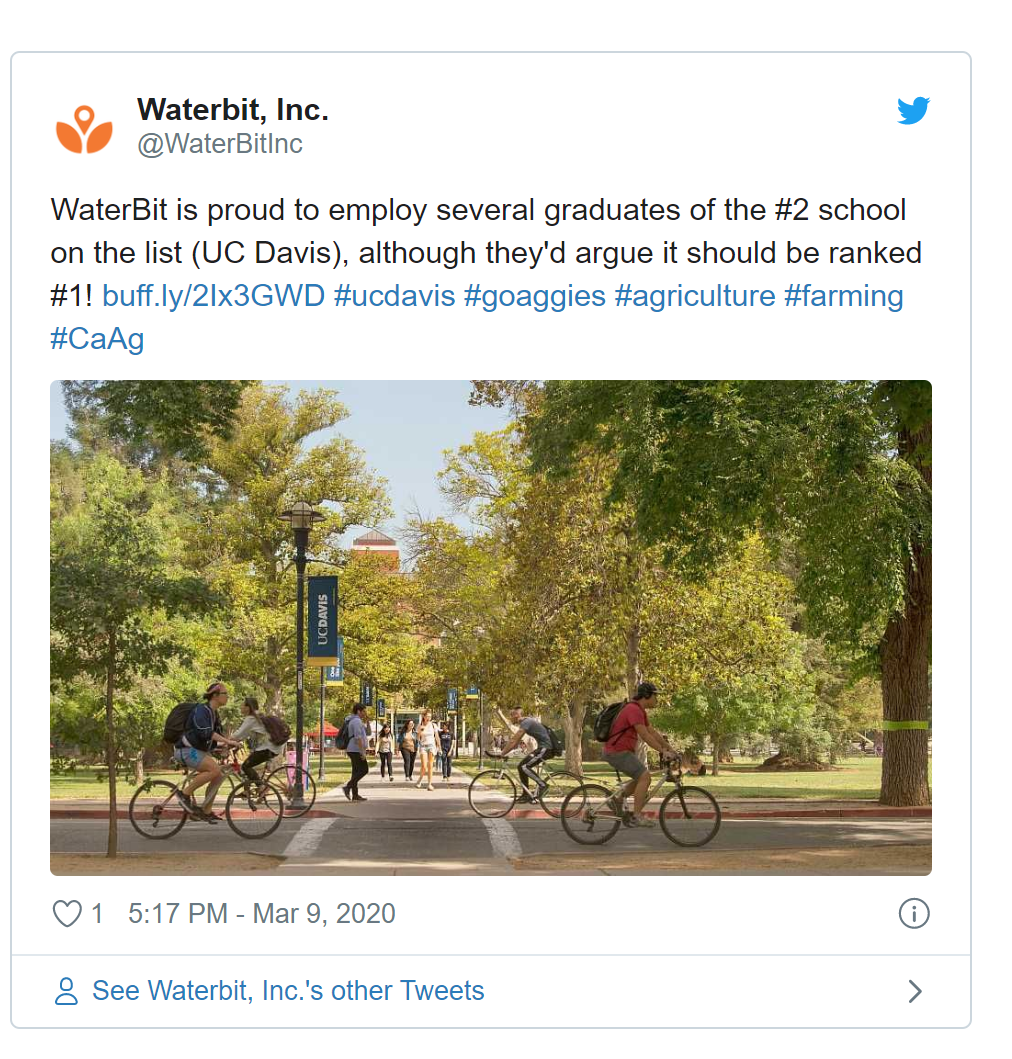
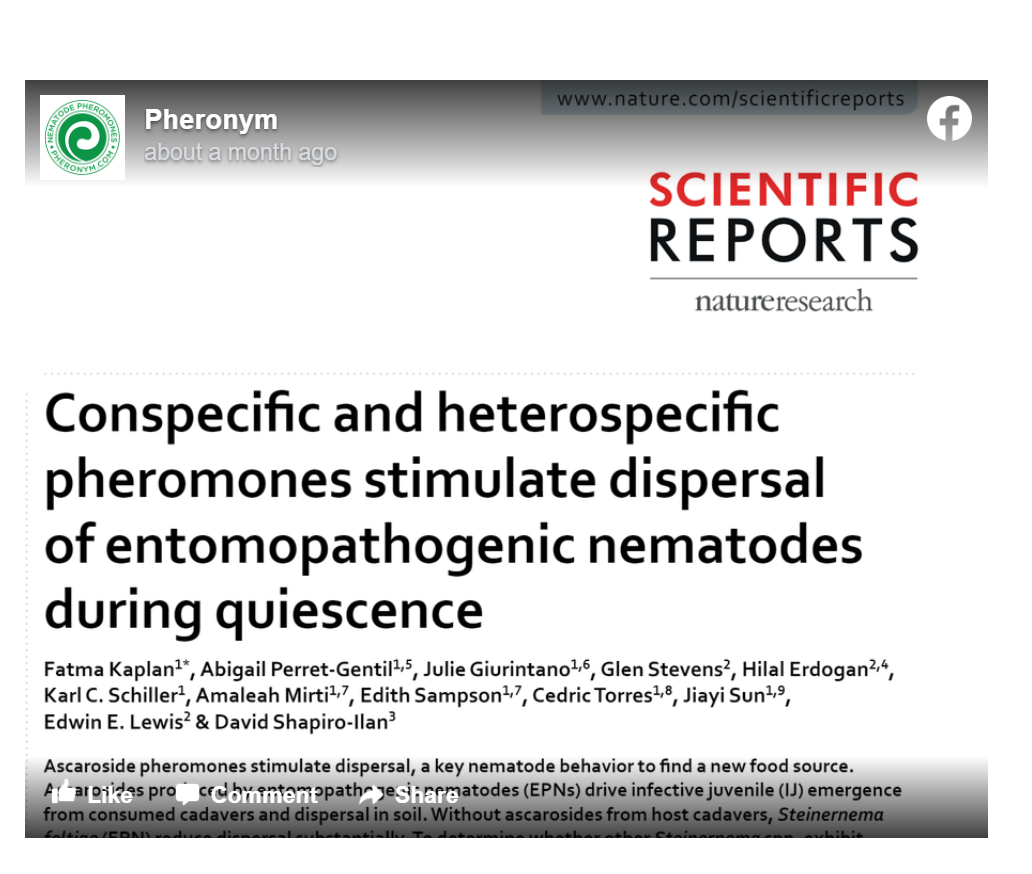
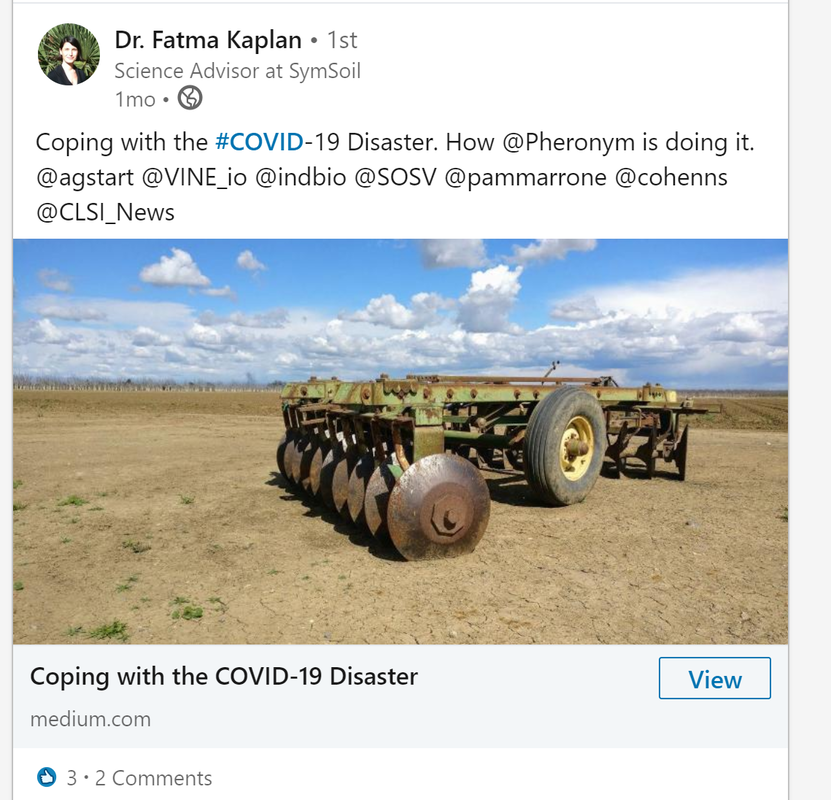
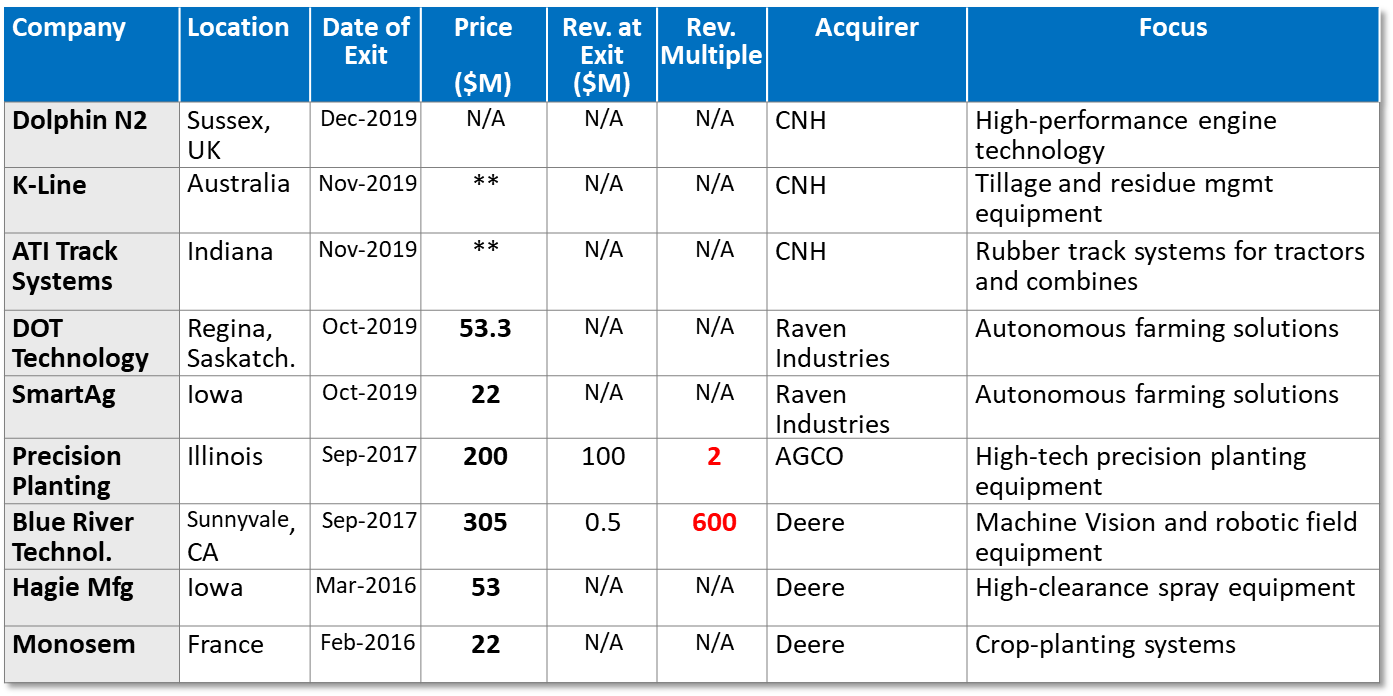
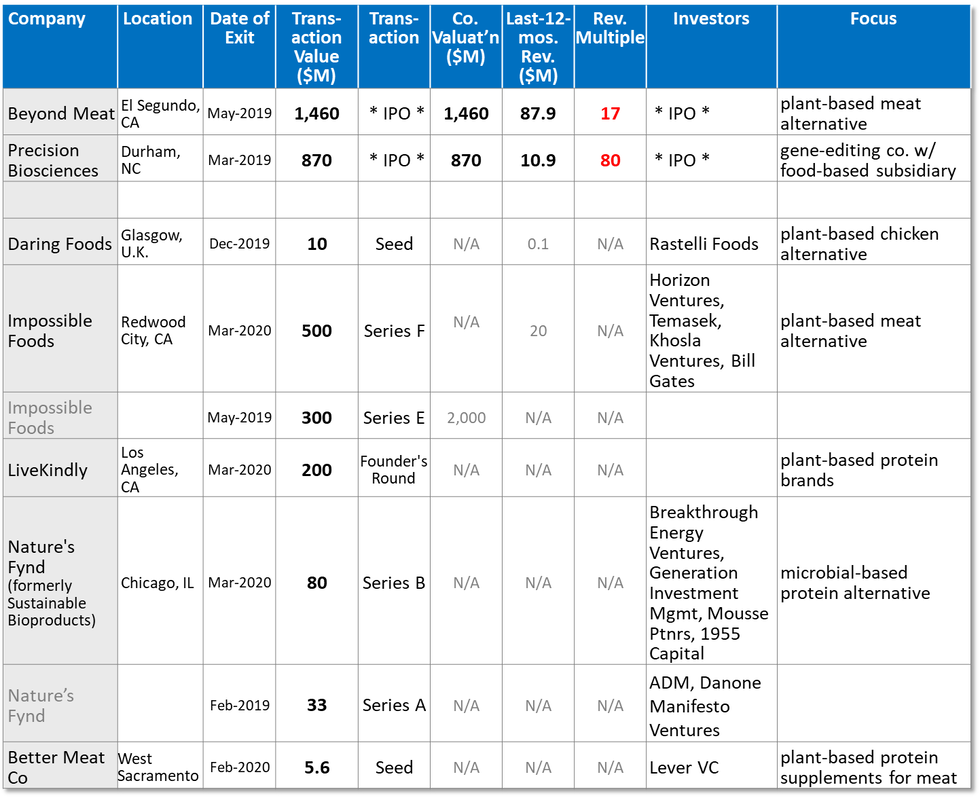
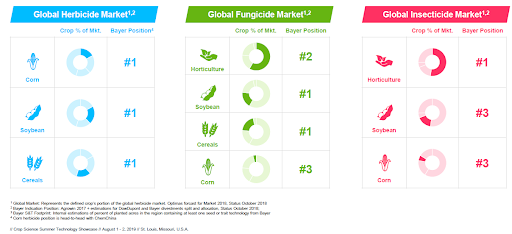
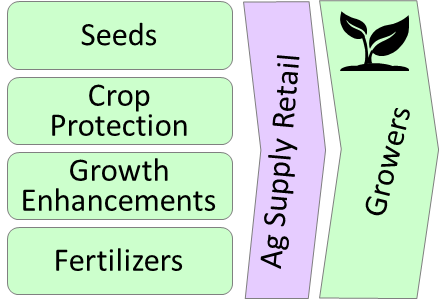
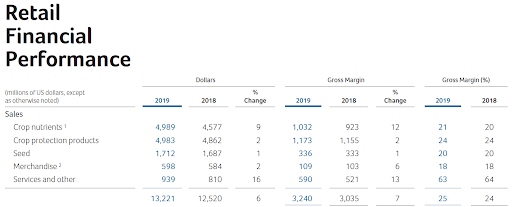
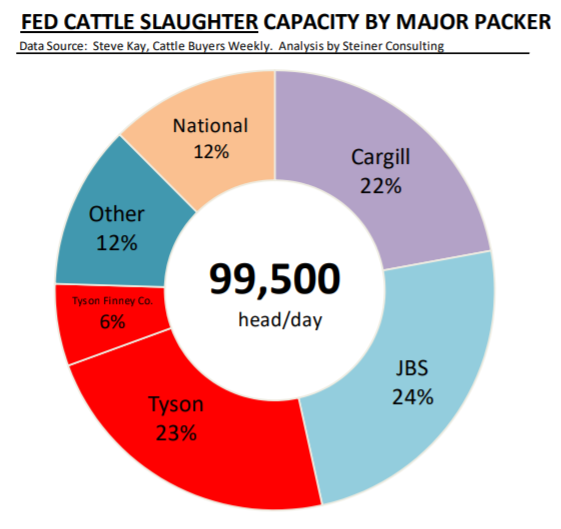
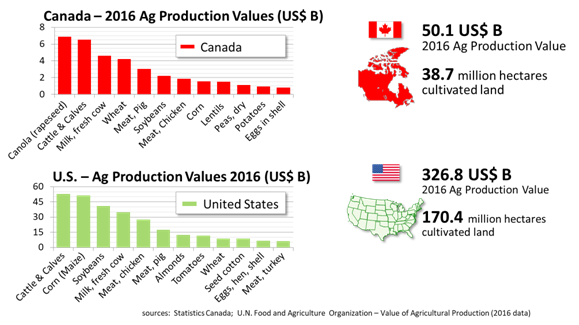
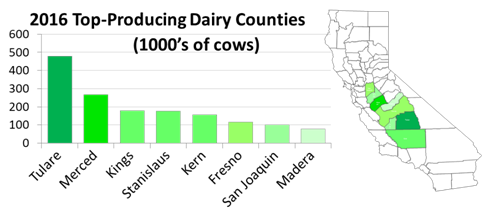
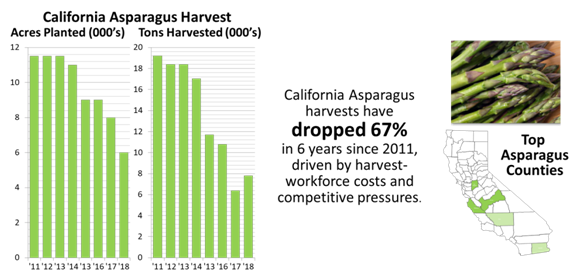
The Raley’s Food Lab will be a certified food facility where innovators can develop new food products, ingredients and recipes for taste testing, sampling and small-volume sales. The facility will be fully outfitted with kitchen and food preparation equipment and will be reservable for use by established and aspiring food entrepreneurs. The Raley’s Food Lab will provide an ideal location for food entrepreneurs to experiment and test new foods and food ingredients in a region renowned for its vibrant agriculture and food innovation ecosystem. Raley’s will also provide entrepreneurs with mentorship and support to help scale their businesses to prepare to sell at retail. Yolo County is known for its diverse agricultural production, and Woodland is the home of several global and local food processing firms. “Raley’s takes great pride operating our business in one of the richest agricultural hubs in the world. We are excited about what this region represents for the future of food production,” said Michael Teel, Raley’s owner. “The Raley’s Food Lab will support food entrepreneurs, who will lead the way to a better food system. We look forward to discovering new products and helping to bring them to our store shelves.” According to a 2019 report by consulting firm ESI, the rise of food entrepreneurship, combined with a changing food system, has generated increased demand for shared-use kitchen incubators. The recent pandemic has only accelerated the ongoing changes in food production and consumption. Consumers are demanding healthier products and more interested than ever in sustainable, local and artisanal foods. "Having access to the Raley's Food Lab will be instrumental for us, enabling us to produce samples of our ingredients for our corporate partners to evaluate. This will help accelerate our product development cycles,” said Anupama Ranganathan, co-founder and chief technology officer of InnovaNutra, Inc., a UC Davis spinout creating plant-based food ingredients to improve flavor, nutrition and shelf-life. "There are very few alternative facilities in our Sacramento region. We previously had to travel several hundred miles to the Bay Area or northern parts of California to prepare samples of our product." As a part of the larger Lab@AgStart incubator, Raley’s Food Lab users will also be able to take advantage of The Lab@AgStart’s co-working office space, as well as AgStart’s business mentoring and advisory services. When it opens April 1st, the Lab@AgStart will be the largest wet-lab incubator facility in the state of California that has an agriculture and food focus, and the only startup incubator in the state combining both a food lab and comprehensive wet lab facility. “A unique advantage of our facility is that entrepreneurs can prepare a new combination of ingredients and cooking techniques in the Raley’s Food Lab, and then immediately take their creation into the Yocha Dehe Lab to assess it for nutrient content and other health attributes,” said Leanna Sweha, AgStart Program Director. “The Lab@AgStart facility will help startups commercialize new innovations for a more sustainable food system, and our facility itself will emphasize sustainability.” The Lab@AgStart will be located at the Woodland Corporate Center, 1100 Main Street, in downtown Woodland, CA, within convenient walking distance of restaurants, coffee shops and other businesses. “The Lab@AgStart will be powered in part by renewable energy generated by our on-site solar-covered parking and will have energy-efficient LED lighting, UV-C disinfecting HVAC and other upgrades focused on sustainability and the comfort of our tenants,” said Brian Wills, Chief Operating Officer of The Wiseman Company, which developed and operates Woodland Corporate Center. Raley’s joins a unique public-private partnership that has come together to fund the $1.5M Lab@AgStart, a shared-use incubator for entrepreneurs and innovators in Ag | Food | Health in Woodland. Previously announced sponsors include The Yocha Dehe Wintun Nation, which is the sponsor of the Yocha Dehe Lab, as well as the U.S. Economic Development Administration, the County of Yolo and the City of Woodland. About Raley’s Raley’s is a privately-owned and family-operated customer experience grocery company headquartered in West Sacramento, CA. Raley’s stores are the destination for the best fresh products, affordable offerings and personalized service. The company’s commitment to infusing life with health and happiness by changing the way the world eats, one plate at a time, has made it a trusted source for food, nutrition, and wellness. Raley’s operates 126 stores under six banners: Raley’s, Bel Air Markets, Nob Hill Foods, Food Source, Market 5-ONE-5 and Raley’s O-N-E Market. Making healthier offerings accessible to everyone, Raley’s has expanded beyond the store to operate grocery curbside pick-up and delivery in their nearby communities. Visit at www.raleys.com. AgStart today announced a unique, broad-based public-private collaboration to fund a new, shared-use innovation incubator in Woodland supporting innovators and startup companies in Ag | Food | Health. When complete, the $1.3M ‘Lab@AgStart’ will feature a fully-equipped shared-lab and kitchen space as well as a co-working office space. Examples of innovations that the Lab@AgStart could support include environmentally- friendly biocontrol products for agriculture, new drought-resistant crops, and new foods and food-as-medicine ingredients. The collaboration includes the U.S. Economic Development Administration, Yolo County, the City of Woodland, the Yocha Dehe Wintun Nation, and a number of other private donors. “Our region has struggled with a lack of laboratory capacity to support emerging companies pursuing science-based innovations,” explained Michael Teel, Chief Visionary Officer of Raley’s and head of the Greater Sacramento Area Economic Council’s Food and Agriculture Innovation Council. “Expanding our region's capacity to support science-based Food and Ag technology innovation strengthens our region's leadership as an Ag | Food | Health innovation hub.” Woodland and the Greater Sacramento region are located in the center of California’s Sacramento Valley region, one of the world’s most productive agricultural regions, but a region threatened by shortages of water and workforce availability. This creates opportunities for innovation – new drought-tolerant plant varieties, less-labor-intensive harvest techniques, and new foods and food ingredients – that could transform our food system. “This land is both our past and our future, and we can’t wait to see what comes next. That’s why we’re proud to contribute significant funding for this project through our Doyuti T’uhkama partnership,” said the Tribal Council of the Yocha Dehe Wintun Nation, a Native American Tribe centered in nearby Brooks, California. “The Lab@AgStart will be all about creating what comes next.” “In recent years, the prominence of UC Davis research in agriculture, food science, and human and animal health, and the strength of California’s Central Valley agricultural economy have generated an explosion of promising startup companies pioneering innovations to improve the productivity, efficiency, and sustainability of our food system”, said John Selep, President of AgTech Innovation Alliance, the non-profit sponsor of the AgStart program. “Developing these new solutions involves scientific testing, development, and refinement, requiring laboratory facilities, which are scarce throughout our Central Valley region. As a result, available laboratory facilities in the Greater Sacramento region have been filled, and new lab capacity has been quickly absorbed.” “When it opens later in 2020, the Lab@AgStart facility will be the largest shared-use wet-lab facility for startup companies in the entire Central Valley region, said John. “Construction on the improvements necessary to outfit the lab will commence this fall and the Lab@AgStart should be ready for occupancy around the end of the year.” A broad coalition of public and private funding sources have been assembled to finance the $1.3 million dollar Lab@AgStart project. “The U.S. Economic Development Administration made the right call in supporting AgStart. Their strong work to support burgeoning companies across the health and agriculture industries will lead to innovations that bolster our nation's food system,” Congressman John Garamendi (CA-03) said. In addition to the Economic Development Administration, both the City of Woodland and County of Yolo have committed financial support to the Lab@AgStart project as well. "We are thrilled by the announcement of the U.S. EDA’s investment in helping grow our local food and agriculture innovation ecosystem,” Woodland Mayor Rich Lansburgh said. “The City of Woodland is proud to partner with Yolo County and industry supporters to promote the scientific community through the launch of the Lab@AgStart, which will offer an affordable state-of-the-art facility in Downtown Woodland. Innovators will have access to Woodland’s network of 190 plus existing food & ag companies that collaborate with the City through the Food Front initiative to transform the way we grow, produce, and enjoy the food that we eat." “The Lab@AgStart is an exciting project for our region that further strengthens our ag and life science innovation ecosystem,” said Gary Sandy, Chair of the Yolo County Board of Supervisors. “The County is proud to collaborate with AgStart, the City of Woodland, and the Yocha Dehe Wintun Nation to maximize success for our community.” Private sponsorship of the Lab@AgStart facility includes Bayer Cropscience, Gowan Company, and the Dowling Family. Dr. Matthew Amicucci, principal scientist for BCD Bioscience, said, ”As a young nutritional science platform company recently spun out of UC Davis research, one of our biggest challenges has been finding research facilities in the Yolo County area. The opportunity for expanded lab space will enable us to not only fulfill our internal development and our Bill and Melinda Gates Foundation grant, but also facilitate further growth through collaborative projects with leading go-to-market partners. Dr. Fatma Kaplan, Founder and CEO of Pheronym, a biocontrol startup based in Davis, said, “Finding affordable wet lab space is very difficult for early stage biotech companies. Incubator wet labs have been critical to Pheronym’s early success. Agstart’s new wet lab incubator will fill a critical need in the Sacramento Region.” For more information, click below to visit The Lab@AgStart page: One silver lining to the Covid-19 crisis is the renewed public awareness and appreciation of food production, as a result of supply chain disruptions and shortages of staples at grocery stores. At the same time, consumers are spending more time online consuming information and communicating due to shelter-in-place orders. Agrifood tech startups can seize upon this moment to boost their online presence and name recognition by using social media posts to explain how their technology can make our agrifood system more productive, efficient, sustainable and secure. We’ve selected posts by two AgStart member companies, one post-revenue and one pre-revenue, to illustrate some effective approaches to leveraging free social media platforms. The posts come in a variety of different categories, each of which can effectively tell a firm’s story and drive traffic to its website as part of an overall social media strategy. Waterbit WaterBit helps growers optimize water usage, improve yields, and save on labor costs with its autonomous precision irrigation management system that captures real-time data. WaterBit leverages the three major platforms - Facebook, Twitter and LinkedIn - to reach potential customers as well as other audiences. - Posts on technical product information WaterBit effectively publicizes its free technical webinars on social media. Take this LinkedIn post, for example. Here, general hashtags like #PrecisionAgriculture and #agronomy are used, because the post is geared towards growers of several crop types and others interested in agtech innovation. LinkedIn started out as, and remains a great place for, professional networking, but it also has evolved into a medium for companies to post both evergreen-type and time-sensitive content, like WaterBit’s webinar. - Posts about benefits to specific customers This Twitter post links to a technical report on WaterBit's website that shows the benefits of using WaterBit in a specific vineyard. This case study is for wine grapes. Hashtags for this post include those specifically for the wine grape industry, as well as for big data (#agdata) and water (#agwater) for growers and agronomists who follow precision irrigation posts. Twitter remains a great medium for short, time-specific news items. Waterbit uses this post to attract audiences to its website, where details can be found about the study. - Posts that link to industry press In this Facebook post, WaterBit links to a Western Farm Press article about the California Sustainable Winegrowing Alliance and the 'Certified Sustainable' denomination. Although WaterBit is not mentioned in the article, WaterBit is part of the suite of best management practices that growers can adopt to obtain this certification. These types of posts help build a company's reputation as having industry expertise, which is critical for gaining new customers in agriculture. In addition, because the article is in a general farming publication, WaterBit included hashtags like #foodsupply and #sutainableagriculture in co-posts on Twitter and LinkedIn. - Posts geared towards potential new employees In this Twitter post, WaterBit used recent news about UC Davis' ranking to highlight some of their current employees. This is an effective way to generate interest among students and others potential future hires, especially when appropriate hashtags are included. Pheronym Pheronym is an ag biotech startup that uses nematode pheromones to control beneficial and parasitic nematodes. Pheronym is developing two products – NemaStim and PheroCoat. Nemastim increases the effectiveness of beneficial nematodes that control insect pests in a variety of crops. Their second product, PheroCoat, protects plants from plant parasitic nematodes. Pheronym's founders effectively use both company and personal social media accounts to message a broad audience. - Posts that link to peer-reviewed research articles This Facebook post links directly to a recent research paper proving that Pheronym's pheronomes work in cooler weather, which is significant, because it shows that NemaStim's potential market is over a broad climatic range. The post restates the title using hashtags so that anyone searching on these hashtags will come across the post. In the following Twitter post, Pheronym co-founder Dr. Fatma Kaplan uses an effective graphic to summarize the research results from, and to link to, the same paper. Relevant hashtags, as well as potential retweeters are included. - Posts linking to company mentions in business or news articles As a graduate of the IndiBio Accelerator, Pheronym was hailed in a 2019 Forbes article by SynBioBeta founder John Cumbers as offering an alternative to environmentally damaging pesticides. In the following tweet, Dr. Kaplan quotes the article, which references earlier research demonstrating the effectiveness of NemaStim. - Posts that link to longer form articles in LinkedIn, Medium, etc. LinkedIn and Medium are great resources for posting longer form articles. In this post on her personal LinkedIn page, Dr. Kaplan links to Pheronym's recent Medium article describing the many adjustments - both personal and professional - that the founders have made to deal with the Covid-19 crisis. Here, Pheronym discusses the process it went through to adjust to the crisis and explains that the firm has had to delay important field trials for one year. The article shows Pheronym's thoughtfulness and ability to manage a crisis, which is an important characteristic that potential investors look for in founders and managers. This post illustrates another important point about social media. While social media posts are great to express short messages, they are not geared towards lengthy stories or complicated concepts. Longer form articles can include details and set a tone that simply can't be captured in a short post. Posting effectively on social media takes a commitment, but it’s relatively easy and is gratifying when one begins to build a following and see results. It's useful to study others' approaches, but developing your own social media strategy and style is key. With so much current attention on food security, this is prime time to begin using these valuable platforms for your startup. About the Author: Leanna Sweha, JD, is Program Director of AgStart Tell a Compelling, Data-Driven Story about your Business Part III – Comparable Transactions4/14/2020 For many Ag-&-Food entrepreneurs, telling a compelling story about the magnitude of their innovation, the size of the value chain segments they can transform, and the potential value of their startup enterprise, is essential to their ability to recruit investment, talent, and partners or collaborators in pursuing their innovation. In a data-driven world, there is no substitute for doing the homework to help paint a comprehensive picture. One of the most-important conversations that entrepreneurs have with potential investors is the conversation about company valuation – what their business may be worth today, and what it may be worth in the future. Since nearly every early-stage startup business relies on private financing where there is no public-market valuation, the most important measure of company worth is based on ‘comparable company’ transactions – data from transactions involving ‘comparable’ businesses in comparable or more-advanced stages of development. While this data may be sparse, fortunately there are free data sources available that entrepreneurs can use to help quantify the valuation of ‘comparable companies’ at various stages of development. This article is the third in a series, and summarizes the data sources that entrepreneurs can utilize to build a comprehensive picture of their business’ valuation. What Investors Want to See Equity investors in early-stage businesses are invariably betting that the company they’re investing in today will be worth more in the future. No investor wants to sink money into a company or technology sector for which there are unlikely to be future buyers. The critical questions of course are, what might the business be worth in the future, and what is it worth today? To be more precise, the point where ‘future worth’ is most relevant is at a financial liquidity event or ‘exit’ – an initial public offering (IPO), or more-frequently, a company merger or acquisition transaction. It’s encouraging for potential investors to see that a particular technology sector has active interest from buyers, whether those buyers are public-market investors or large corporate buyers. Investors frequently ask entrepreneurs whether there have been any successful exits by comparable companies in the entrepreneur’s chosen sector. While potential investors could do this research for themselves, it is often easier for entrepreneurs to assemble this list of ‘comparable company’ transactions, since the entrepreneur typically understands more about their particular sector and their fellow innovators than an outside investor. Entrepreneurs can become knowledgeable about their chosen industry sectors and discuss company valuation and future outcomes with investors more confidently once they’ve done this exercise themselves. Most importantly, entrepreneurs can help their potential investors more-quickly come to these conclusions on potential future valuation by cataloging ‘comparable company’ transactions among companies involved in or closely related to the industry sectors in which the entrepreneur operates. Web-based Data Sources There are a wealth of web-based resources available to help in this process. Four of the best, for companies in the Ag-&-Food technology sector, are cataloged below. AgFunder – As the most-focused financial information provider focused on the startup Ag-&-Food and technology sector, AgFunder offers a wealth of news articles and periodic reviews of investment in the Ag-&-Food technology domain (https://agfundernews.com/). AgFunder can be useful for finding the names of startup companies active in a particular sector. However, AgFunder is not as useful for identifying details about specific investment transactions. Crunchbase – Crunchbase (https://www.crunchbase.com/) is an excellent web-based service for understanding key aspects about startup companies and investors, across any industry sector. Crunchbase operates on a ‘freemium’ model, with some private company information available to entrepreneurs at no charge, and a subscription-based Crunchbase Pro service focused on providing more-detailed private company and investor information. Armed with a company’s name, entrepreneurs can use the free level of service to access very detailed information on funding rounds for individual startup companies, including the dates and sizes of most-recent funding rounds, as well as lists of principal investors/venture firms active in that round. Crunchbase also has an online News publication (https://news.crunchbase.com/) with frequent articles on Venture capital and private company funding information. Pitchbook – Pitchbook is a subscription-based service targeted for venture capital investors and other institutional investors. However, the firm’s Pitchbook News service (https://pitchbook.com/news) offers free news articles, such as periodic reviews of significant venture financing events (https://pitchbook.com/news/articles/best-funded-startups-in-q1-are-boosted-and-battered-by-the-coronavirus). As a targeted research tool, however, the information available on the site for non-subscribers is not as useful as Crunchbase. The U.S. Securities and Exchange Commission (SEC) – The SEC’s EDGAR database (https://www.sec.gov/edgar/searchedgar/companysearch.html) is the universal authority for obtaining company filings from both publicly-traded companies and privately-held companies, including angel- and venture-backed startup companies. The use of EDGAR for publicly-traded companies is discussed in Part II of this article series. Cataloging ‘Comparable Company’ Transactions The first step for an entrepreneur is cataloging the names of all of the known participants (partners, competitors, complementary providers, etc.) who intersect with the particular sector in which the entrepreneur’s company intends to operate. A strong starting point is the list of key strategic players that the entrepreneur may already have assembled (see Part II of this series of articles, at https://www.agstart.org/resources/tell-a-compelling-data-driven-story-about-your-business-part-2-key-strategic-players). Add to this list a list of the names of all the venture-backed startup companies that participate in this sector. For each of the larger publicly-traded or privately-held companies, did any of these companies buy or acquire any other companies to enter or expand their operations in this segment in the past three-to-five years? Were any of these larger companies previously classified as startups or venture-backed companies in the segment? This may take some sleuthing to understand ‘who used to be a startup in this space’, and ‘what happened to them?’. Sources may include news clippings, trade press, or conversations with others in the industry who may recall the history of startups in the sector. In this way, the entrepreneur can assemble a list of the ‘exits’ or financial transactions within their industry or related sectors in the past three-to-five years. Once an entrepreneur has identified the name of a company that has experienced a merger or acquisition in the sector, a web search on the company name will frequently return a wealth of information on the company, and often a business press article on the acquisition transaction. The key quantitative questions to capture are ‘what was the value of the transaction’, and if possible, information about the company’s size – revenue, personnel, or other measures. On a qualitative level, it’s important to understand ‘Was the company perceived as successful, and acquired by a larger firm seeking to capitalize on the startup company’s rapid growth’, or was the transaction more of a graceful exit by company investors looking to bow out of a troubled business? Other qualitative details to capture include what was the state of maturity of the company’s business, in other words, did it have products in the market, or was it pre-revenue with a promising pipeline or key product, and at what stage? Assembling Your ‘Comparable Company’ Exits Table If the entrepreneur is lucky, financial details of any acquisition transaction may be accessible in a business press article describing the acquisition transaction. More commonly, the financial details aren’t fully disclosed to the press. However, this isn’t a dead end. If the acquiring company is publicly-traded, details of the accounting for the acquisition must frequently be disclosed in the acquiring company’s financial filings, such as their quarterly and annual reports to the SEC. The most-common place where this information is captured is in the ‘Notes to the Consolidated Financial Statements’, under the category of ‘Accounting for Acquisitions and Divestitures’ in the acquiring company’s annual 10-K or 20-F filing for the period in which the acquisition transaction occurred. Publicly-traded companies often discuss the detailed accounting of acquisitions in excruciating detail, including the accounting of transaction value, goodwill, assets, acquired debt, and other matters. If the company has acquired two or more companies in the past year, their annual report may discuss each transaction separately, allowing the entrepreneur to easily identify the valuation and other details for the transaction of interest. Occasionally, math is required. If an entrepreneur is unfamiliar with the terms or language used in the ‘Notes’, finding a friend or advisor who has a financial background can be useful in extracting the most-useful information from the ‘Notes’. There are many nuances to acquisition accounting, but the key measures for ‘comparable company’ transactions is the price/valuation of the transaction, and some measure for the business acquired (last-twelve-months revenue at the time of acquisition, is one of the best metrics). If a company in your chosen industry sector has successfully executed an initial public offering (IPO), information about the transaction, including detailed histories of the company’s revenue and profitability, will be found in the company’s S-1 filing registered with the US SEC and accessible through EDGAR. These documents may also be available from the Investor Relations page on the company’s own website. The S-1 filing is a wealth of information, as it shows the company’s revenue trajectory and revenue growth rates for the several years leading up to the IPO. Entrepreneurs may be able to map their own company’s projected revenues and revenue growth rates in the future, and map them to the IPO company’s history to project where their own company may be on the path to an IPO. Sector ‘Exits’ Tables – Examples Ideally, the entrepreneur will be able to assemble a table of ‘comparable company’ exit transactions that excite their potential investors on the opportunities to profit from an early-stage investment in their firm. Below is an example list of recent acquisitions in the Agricultural Equipment segment. sources: company press releases, company filings. ** CNH reported in their annual 2019 20-F filing (pg. F-11) that the combined value of their K-Line, ATI Track Systems, and AgDNA (software) acquisitions was "approximately $100 million in aggregate". More-detailed breakouts were not available. As entrepreneurs will see, complete information is not always achievable, even for transactions by publicly-traded companies. However, even if full information on a particular transaction is not available, tracking these transactions demonstrates the overall volume of transactions within the industry. A similar situation can be found in the Precision Agriculture software sector, which has been undergoing a high level of consolidation in the past several years. sources: company press releases, company filings. ** CNH reported in their annual 2019 20-F filing (pg. F-11) that the combined value of their K-Line, ATI Track Systems, and AgDNA (software) acquisitions was "approximately $100 million in aggregate". More-detailed breakouts were not available. Digging Deeper – Sector Financings as well as Exits Recording acquisitions and exits paints a picture of what success might look like for mature startup companies in a sector, but doesn’t help as much for establishing current company valuations when an entrepreneur is raising capital right now. To understand comparable startup company valuations, the entrepreneur can assemble a table of recent financing transactions among comparable privately-held startups in their sector. Every privately-held company that raises funds from (in other words, sells securities to) investors, must notify the US SEC of their securities sale through the filing of a simple Form D for each financing round. These ‘Form D’ filings are available for public inspection, through the SEC’s EDGAR search function, and form the foundation of what companies like Crunchbase use to populate their startup databases. For each privately-held or venture-backed startup in the entrepreneur’s chosen sector, the entrepreneur can browse Crunchbase or the SEC EDGAR site to understand whether the company has had a recent financing, the date and amount of these financing, and the history of the company across several rounds of financings. (If a startup company has changed its name, it’s best to search EDGAR and Crunchbase for each of the names, as regulatory filings may or may not reflect the company’s most-current name). Through Crunchbase, the specific investors in each company’s financing round can often be found, giving a very clear view of who is investing in this sector. Although private company valuations are not generally disclosed, an entrepreneur can get a reasonable estimate of relative valuations among companies by the size of the funding rounds these companies have raised. Generally, the size of a venture-backed company’s financing round won’t exceed perhaps 33% of the ‘post-money’ valuation of the company (if it did, the dilution of the company’s existing ownership shares could be considered excessive). And similarly, company management want to make their fund-raising efforts meaningful (they don’t want to raise less than what their firms can reasonably support), so a successful fund-raising round generally wouldn’t be less than 20-25% of the company’s ‘post-money’ valuation. This means, for example, that if a startup raised a $10M financing round, the company’s current ‘post-money’ valuation could be assumed to be at least $30M (if the new financing represented 33% of equity), and could be as much as $40M (if the new financing represented 25% of equity). There are many exceptions, of course. An entrepreneur assembling a table of ‘comparable company financings’ could begin to tell a narrative about ‘Company X achieved this milestone, and was worth roughly Y’, and ‘this is why we think we’re at a comparable stage and worth roughly Z’. Sector Financings – Examples One of the more-popular Ag-&-Food technology sectors, plant-based proteins, has seen some spectacular exits, with two Initial Public Offerings of stock in the past year, with another (Impossible Foods) potentially on deck in the coming year. There have also been a number of recent financings within the sector, which helps potential investors understand the level of enthusiasm other investors are showing for the segment. The table below catalogs both recent exits as well as recent financings within the sector. sources: Crunchbase, AgFunder, SEC EDGAR, DUNS, company press releases, company filings.
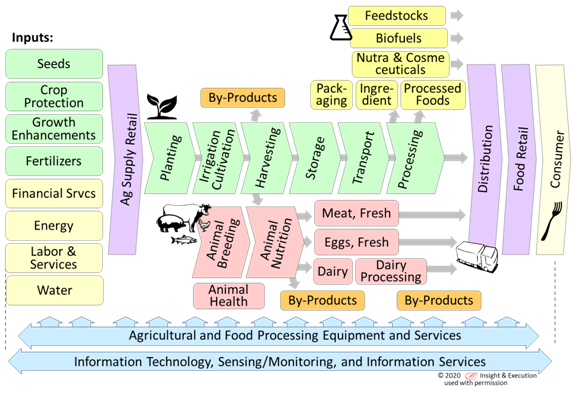
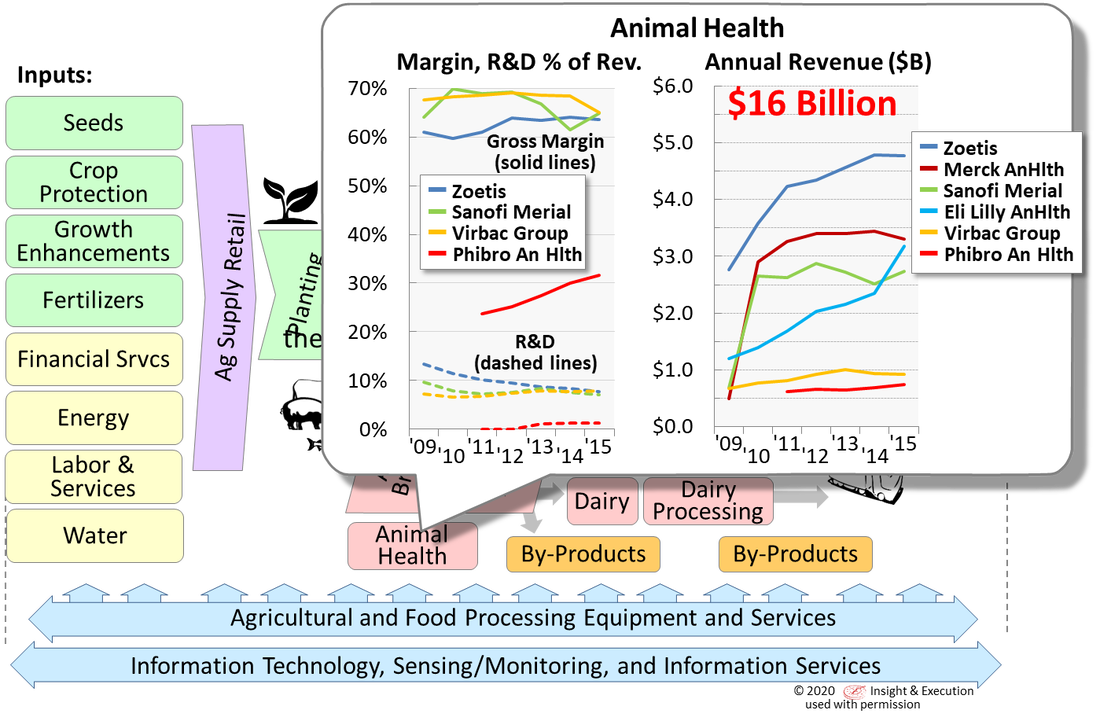
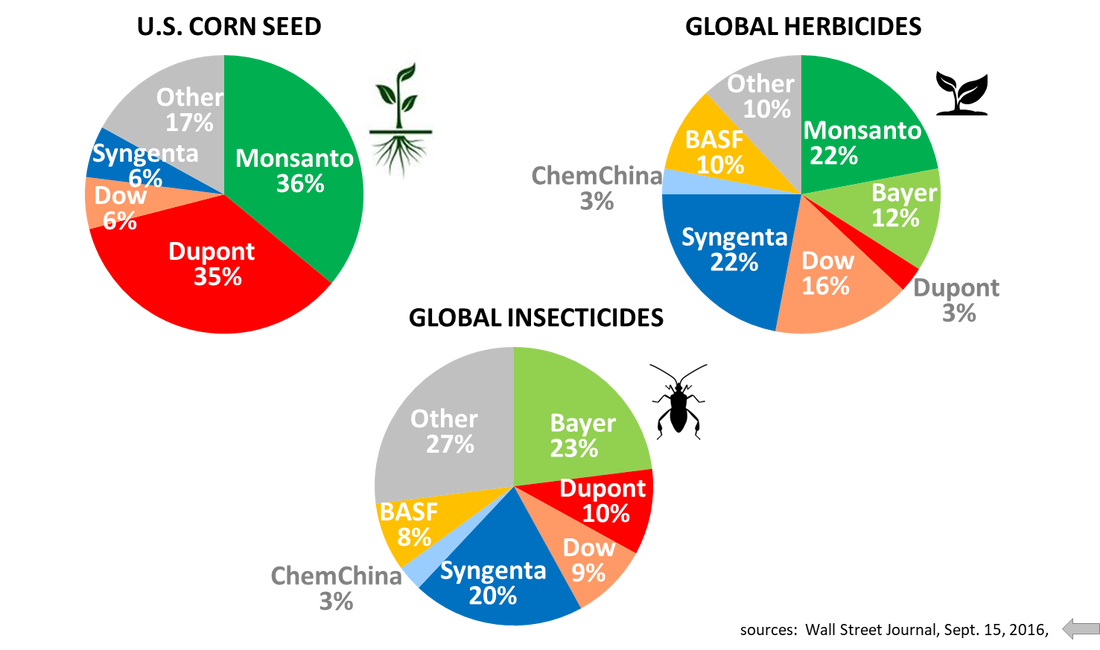
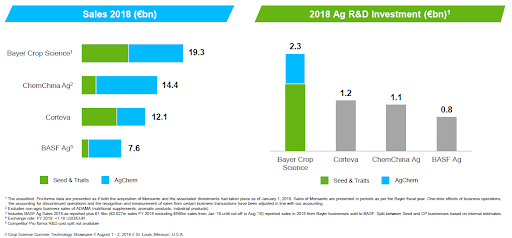
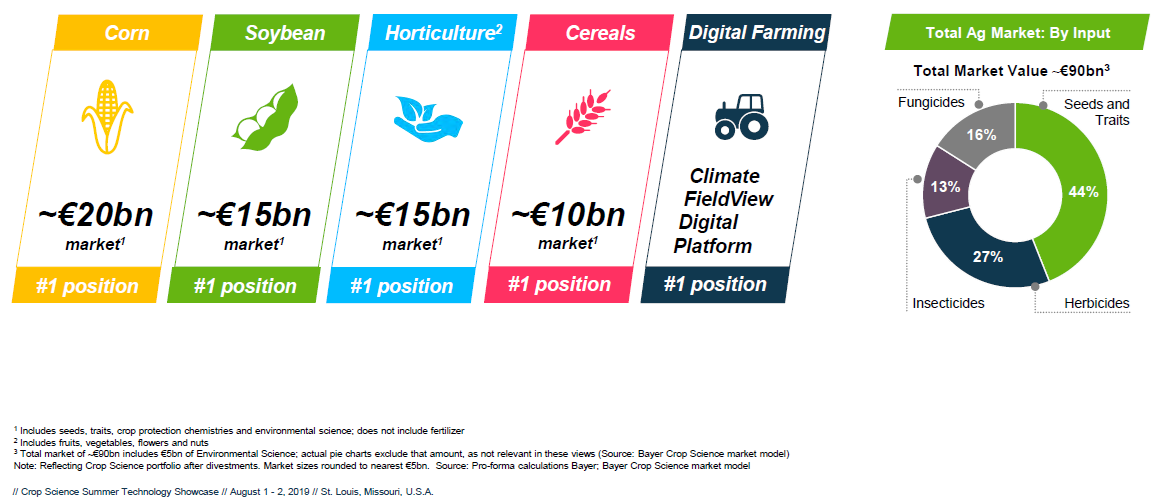
Armed with this recent-transaction information on their specific sectors, entrepreneurs will be ready to engage with potential investors in a conversation of what their business may be worth today, and what the business may be worth in the future. With such a wealth of no-cost data available online, innovators and entrepreneurs can easily take advantage of these resources. It should only take a few hours to capture and represent the most up-to-date information on their specific industry or value-chain segment, who their key potential suppliers, collaborators, customers, and ‘exit’ partners might be, and the history of ‘comparable company’ transactions in their sector. This time would be well-spent to enable entrepreneurs to present their businesses as knowledgeably and professionally as possible to prospective customers, partners, employees, and investors. About the Author: John Selep is the Co-Founder and President of the AgTech Innovation Alliance, the 501(c)3 non-profit behind AgStart. For many Ag-&-Food entrepreneurs, telling a compelling story about the magnitude of their innovation, the size of the value chain segments they can transform, and the key strategic companies who care deeply about what they are doing, is essential to their ability to recruit investment, talent, and partners or collaborators. In a data-driven world, there is no substitute for doing the homework to help paint a comprehensive picture. Fortunately, there is a wealth of free data sources available on our global Ag-&-Food ecosystem and the key strategic companies that populate that ecosystem. This data can help entrepreneurs quantify the magnitude of their innovation and its potential impact on the strategic companies in their segment. This article is the second in a series, and summarizes the data sources that entrepreneurs can utilize to build a comprehensive picture of the key strategic players in their value chain – the companies whom their innovation may threaten, or represent potential partners, channels, investors, or future acquirers of their unique business propositions. Innovations in Ag-&-Food technologies offer the promise of transforming the productivity, efficiency, nutritional value and sustainability of individual segments of this value chain. For an entrepreneur to tell a compelling story about their specific innovation, it’s important to be able to identify the segment of this value chain they’re impacting, and the key roles of existing players in the segment – the large and medium-sized companies that populate their segment – where the entrepreneur’s innovation may either augment or disrupt the existing player’s offerings. An entrepreneur should be able to identify who represents potential suppliers, collaborators, channel partners, competitors, or customers. Investors often want to understand who might represent potential ‘exit partners’ for their investment in a startup. Entrepreneurs can demonstrate their commanding knowledge of their market segment by helping investors assemble this list of candidates. This list nearly always starts with the strategic companies who already populate adjacent segments. Fortunately for entrepreneurs, deep insights on these larger, often publicly-traded, companies are readily available from those companies’ own websites. Public-Company Data Companies whose securities are publicly traded on stock markets in the U.S. and major markets overseas are required under securities regulations to file regular periodic financial reports. This information is available publicly, both from the government regulatory agency sites, as well as from the company’s own website, typically under an ‘Investors’ or ‘Investor Relations’ page . For companies traded on US exchanges, the U.S. Securities and Exchange Commission (SEC)’s EDGAR site (https://www.sec.gov/edgar/searchedgar/companysearch.html) provides access to all of these companies’ filings, including both quarterly and annual filings. U.S.-based companies file an annual 10-K report, with a format specified by the SEC, and quarterly 10-Q reports, with the most-recent financial figures. Non-U.S.-based companies whose securities trade on U.S. Exchanges file an annual 20-F document – with largely similar content. Although quarterly reports can have the most-recent content, these quarterly reports are often abbreviated documents – the most-extensive information and management narrative is typically in the most-recent annual report. These regular financial filings can be a gold-mine of data for entrepreneurs. These required financial filings are not simply tables of numbers. Rather, they include detailed narratives of competitive environments, different segments in which the companies operate, key trends that the company is responding to or strategic areas where the company is focusing their investment. Some firms use their annual 10-K filing as their annual report to shareholders, while other companies may create highly-produced, photo- and infographic-laden annual reports to shareholders, often with the regulatory 10-K information included as an appendix. These annual reports often contain valuable insights about markets, market share, and company strategies, including their direction for future investments (or potential acquisitions). Major suppliers, and major customers, if these relationships are meaningful (generally 10% of more of company sales) are disclosed in the documents. Recent acquisitions and divestitures, if they are ‘material’ to the business – exceeding 1% of revenues or assets – are also disclosed and discussed with key financial details. Companies often compare themselves to those they see as competitors, making it easy for entrepreneurs to assemble a picture of who’s who in the segment. Sometimes even more revealing may be company presentations that the companies may post on their investor web pages as well. In the interest of transparency, whenever a publicly-traded company makes a presentation at an investment conference or earnings release, the company typically posts the same presentation on their investor pages. These presentations are full of information that goes beyond purely financial numbers and often reveal details of industry factors or market trends the company is reacting to, company market share versus competitors, and strategic directions in terms of research and development. Observation: The author has noticed that market leaders in a particular category are particularly prone to disclosing market share for themselves and their competitors – they’re rightly proud of their market position and want to share this with their investors. These can be excellent sources of information for entrepreneurs. For each of the segments in the Ag-&-Food value chain depicted at the top of this article, it’s frequently possible to identify one or more publicly-traded companies who participate or concentrate their activities in that segment. By studying the annual filings of these companies, entrepreneurs can develop a comprehensive picture of the relative size of these companies, and the typical gross margins, R&D intensity (R&D spending as a percentage of revenue), and marketing spend of the established companies within their chosen segments. For example, in the Animal Health sector, there has been one ‘pure-play’ publicly-traded Animal Health company, Zoetis, but also many ‘animal health’ divisions within established global pharmaceutical companies. The annual reports from each of these global pharmaceutical companies frequently break out detailed financials on the size and performance of their animal health divisions. Private Company Information Privately-held companies and industry cooperatives represent some of the largest players across many segments of the Ag-&-Food industry, from Mars, Cargill, and Land O’Lakes to ChemChina AG (Syngenta), Wonderful and MorningStar. Most of the Ag supply retailers, and most equipment and services dealers who provide equipment to growers and producers on a local or regional level, are privately-held companies or cooperatives. Many of these privately-held companies and cooperatives publish general company information on the web, as they all serve audiences of customers, partners, and employees. Detailed financial information on private companies and cooperatives is harder for entrepreneurs to obtain, however, as there is no requirement for these privately-held companies to disclose any financial information publicly. Fortunately, large privately-held companies and cooperatives can leave a large footprint, so relatively-detailed market share and estimated revenue information about these companies can be gleaned from market-share reports from their competitors, or from industry trade press (see examples later in this article). Publicly-traded companies that have merged, or been taken private in private-equity transactions, which is a common occurrence in the Ag-&-Food industry, may no longer post annual reports on an ‘Investor’ web page. However, their past regulatory filings remain permanently accessible on the SEC EDGAR website (https://www.sec.gov/edgar/searchedgar/companysearch.html) for any periods where these filings were required to have been filed. For privately-held companies that are in the early stages of registering for an initial public offering (IPO), these companies must file an S-1 filing with the U.S. S.E.C. These S-1 filings are very revealing in terms of previous company history and revenue growth rates, gross margins, staffing and marketing spending, which may previously never have been made public. Even if the IPO is called off or never executed, these regulatory filings are part of the public record and can be found on the SEC EDGAR website. Industry Trade Press Nearly every segment of the Ag-&-Food industry has a trade press publication, an industry association, or a regional commodity board, or in some cases, multiple organizations that track and report on that segment. One of the most-popular activities these organizations do periodically is publish data on the size and share of their industry segment – ‘Top-10’ or ‘Top-100’ lists of major producers, employers, etc. in their category. These listings are highly useful to entrepreneurs to understand who’s on top, and who’s ‘hungry’ – potentially willing to partner with an innovative startup company to try to displace the industry leader. Examples of market insight ‘gems’ from these trade press sources are shown in the following three examples. Three Sector-Specific Analyses: 1) Seeds and Crop Protection – Key Players Across the many sectors in the Ag supply chain, there has been significant consolidation down to a handful of major global suppliers. For example, in the seeds and crop protection spaces, what was once the ‘Big Six’ global suppliers consolidated down to four within the past five years. With the 2015 merger of Dow and Dupont, spinning their combined agriculture operations out in 2019 into what is now Corteva, the 2016 acquisition of Syngenta by ChemChina AG, and the 2018 merger of Bayer and Monsanto, the former ‘Big-Six’ in seeds and crop protection have become the global ‘Big-4’. A revised picture, reflecting post-consolidation market shares, can be found in a Bayer Technology Showcase slide deck, August 2019 (source: https://www.investor.bayer.com/en/handouts/investor-handout/; select ‘Crop Science Summer Technology Showcase Investor Handout August 2019’) And a further breakdown of each of the herbicide, insecticide, and fungicide markets by target crop, in the following slide: Coupled with the overall market size estimates from Bayer’s earlier slide, this market breakdown by target crop enables entrepreneurs to assemble very-detailed insights about crop protection markets and players that they can customize to address their specific market or target crop of interest, without spending thousands of dollars on analyst reports or custom market research. (Note that ChemChina AG is not a publicly-traded company and as a result, very little published information is otherwise available). 2) Ag Retail – Key Players and Economics A significant volume of seed and crop protection products are distributed to growers around the country and around the world through Seed and AgChemical retail dealers. As it turns out, the Seed and AgChem retail channel is highly fragmented in the United States, with CropLife (https://www.croplife.com/top-100/) publishing an annual ‘Top-100’ listing of Ag retail players. Interestingly, nearly all of these AgRetail distributors are either cooperatives or privately-held companies, for which financial information is hard to find. However, one of the country’s largest retailers, Nutrien Ag Services (formerly Crop Production Services), is a division of Nutrien, a publicly-held company that publishes information annually on sales and gross margins by product category. Given the competitiveness of the Ag retail channel, Nutrien Ag Services’ margins on selling seeds and AgChem products are likely a good proxy for the margins earned by other (even privately-held) players in the same industry. (source: Nutrien 2019 Annual Report, pg. 26. (https://www.nutrien.com/investors) 3) Protein Production Segment – Key Players and Market Shares The U.S. protein production segment (chicken, beef, and pork) is another very large market segment that is sharply consolidated. Information on key market share relationships among competing suppliers, by protein category, can be found in this Tyson Foods slide from Feb. 2016: 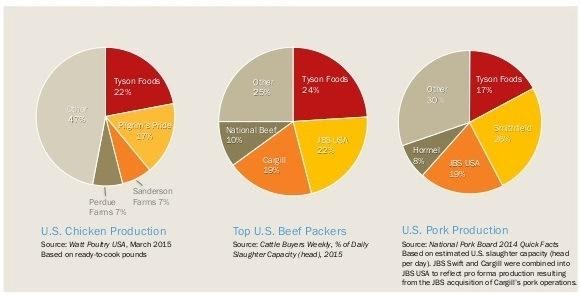 (source: Tyson Foods, Inc. Investor Presentation, February 2016, pg. 14) Tyson’s chart is revealing in that it shares information about JBS and Cargill (the #2 and #3 players in the market, respectively), both of whom are privately-held companies and don’t disclose their own financial information (Note that Pilgrim’s Pride is a JBS brand). Further, Tyson has listed the sources for their market share breakdowns, such as Cattle Buyer’s Weekly. While Tyson hasn’t updated this image in their most-recent Investor Presentation (more-recent Tyson presentations remove the names of their competitors), sources such as Cattle Buyer’s Weekly still report updated breakdowns of slaughter capacity by provider, which can be found by searching the web (see, for example, http://www.dailylivestockreport.com/documents/dlr%2008-12-19.pdf for an August 2019 version): With such a wealth of no-cost data available online, innovators and entrepreneurs can easily take advantage of these resources. It should only take a few hours to capture and represent the most up-to-date information on their specific industry or value-chain segment, and who their key potential suppliers, collaborators, customers, and ‘exit’ partners might be. This time would be well-spent to enable entrepreneurs to present their businesses as knowledgeably and professionally as possible to prospective customers, partners, employees, and investors. About the Author: John Selep is the Co-Founder and President of the AgTech Innovation Alliance, the 501(c)3 non-profit behind AgStart. Tell a Compelling, Data-Driven Story about your Business - Part 1 - GLOBAL VALUE CHAIN SEGMENTS4/2/2020 For many Ag-&-Food entrepreneurs, telling a compelling story about the magnitude of their innovation, and the size of the value chain segments they can transform, is essential to their ability to recruit investment, talent, and partners or collaborators in pursuing their innovation. In a data-driven world, there is no substitute for doing the homework to help paint a comprehensive picture. Fortunately, there is a wealth of free data sources available on our global Ag-&-Food ecosystem that entrepreneurs and innovators can use to help quantify the magnitude of their innovation. This article summarizes a few of these sources that entrepreneurs can utilize to build a comprehensive picture of the value chain segments relevant to their unique business ambitions. The Global Food Value Chain Our world’s food system represents one of the most extensive global value chains, feeding nearly 8 billion people on a daily basis. Within this value chain, many existing suppliers, retailers, growers, producers, processors and service providers participate and contribute value at multiple points, representing multiple trillions of dollars of annual production, processing, and consumption. Innovation in agriculture and food technologies offers the promise of transforming the productivity, efficiency, nutritional value and sustainability of individual segments of this value chain. Countless opportunities exist throughout this complex value chain where innovators and entrepreneurs can offer unique solutions. For an entrepreneur to tell a compelling story about their specific innovation, it’s important to be able to relate how their innovation fits in a larger value chain - who are their customers, who are their suppliers, and what existing providers would they be assisting or displacing as a result of their innovation? Putting magnitudes on the size of these value chain segments is a first step, but also important considerations are developing trends, over what timeframes, geographies and other segmentation. Global Ag-&-Food Data The comprehensive source for globally-comparable data across countries or regions is the United Nations Food and Agriculture Organization (UN FAO). The UN FAO offers an ‘FAO STAT’ interface on their FAOSTAT website (http://www.fao.org/faostat/en/#data) that offers comprehensive searchable data and statistics on animal and crop production (quantity), value of agricultural production, volume of inputs (fertilizer and pesticide use), land area, commodity pricing, imports and exports by country, etc. over a range of timelines. The data sets are updated annually with the most-recent comprehensive data available through 2016. Anyone can access the information and select from a range of factors to customize the domain and range of data, geographies, and timeline to align with the specific question of interest, and the information can easily be downloaded from the site in spreadsheet form for further analysis and presentation. Examples of the types of UN FAO information that can be extracted are shown below: EU Ag-&-Food Data At a more-regional level, crop production information can be extracted from regional governmental organizations such as EuroStat (https://ec.europa.eu/eurostat/data/database), with data on production and trade by crop, geography, with values in production quantity, value, area, and yield), and with data from as recent as the 2019 crop year. The extensive EuroStat database can be navigated through a unique click-through navigation tree to identify the specific domain of interest (e.g., ‘Agriculture, Forestry, and Fisheries’), and then the user can open a Data Explorer to select the specific data values, geographies, and timescales of interest. Extensive data on organic production and other themes is also available. US Ag-&-Food Data For United States data, a comprehensive picture can be extracted from the US Department of Agriculture (USDA) Quickstats database (https://quickstats.nass.usda.gov/), with data available on animal and crop production quantity, value, acreage, chemical and fertilizer use, and a variety of other data values, by geography, state, and even county levels, for crop years as current as 2017 and 2018. The QuickStats data-selection interface is relatively intuitive, allowing the user to select the specific data fields, and showing additional data fields as relevant to what the user has already selected. (For example, some data is only available on a periodic ‘sampled’ basis. For comprehensive data, select ‘Census’ rather than ‘Survey’). For example, sometimes county-level data is available for specific data values, and for other selected data fields, it is not. Data values can be as recent as the 2019 crop year for some selected data values, while for others, data is available only through 2018 or 2017. When selecting data by state or county, the user can select the specific state, states, or counties of interest, or simply let QuickStats return all of the available data for that specific selection to identify which states/geographies are relevant. QuickStats data can easily be downloaded from the web interface in spreadsheet form for further refinement or analysis. Examples of the kinds of data that are available through QuickStats include the following: Often, more-specific information on individual states or commodities, including export and trade values, can be found on individual state agriculture department websites, such as the California Department of Food and Agriculture (CDFA) website (https://www.cdfa.ca.gov/statistics/). The CDFA site includes comprehensive reports by crop year with extensive information by crop and county-level data going back many decades, but the information is published in a static form that often requires manual effort to tabulate and correlate into time series. Fortunately, much of this state and county-level data is available from the USDA QuickStats site in a more searchable form. Trade Association Data Information on specific food-industry topics can also often be found by looking at websites of specific commodity or industry-associations, that provide public information and advocate for their particular agricultural commodity or industry segment. For example, the Plant-Based Foods Association (https://plantbasedfoods.org/) has a wealth of information on consumers (https://plantbasedfoods.org/marketplace/consumer-insights/), and industry sales trends (https://plantbasedfoods.org/marketplace/retail-sales-data/) that can be leveraged to educate audiences and investors about trends relevant to entrepreneurs in those industry segments. Commodity Board Data Many individual crop commodities in the country and in California have a state-chartered commodity board advocating on behalf of that commodity, and making public information available on their crop as part of their advocacy. For example, an excellent example of this is the California Almond Board, which publishes a wealth of statistical information on their website (https://www.almonds.com/growers/resources/almond-almanac-industry-stats), covering production, farms, acreage, inventories, exports and trade, as well as sustainability topics and industry marketing efforts globally. Annual almanacs going back several years are available, for constructing time-series data. With such a wealth of data available, innovators and entrepreneurs should take advantage of these resources. A few hours spent to capture and represent the most up-to-date information on their industry or value-chain segment, and how their innovation might save costs, improve efficiency, reduce inputs or improve sustainability, would be well-spent to enable entrepreneurs to present their businesses as knowledgeably and professionally as they can to prospective customers, partners, employees, and investors. About the Author: John Selep is the Co-Founder and President of the AgTech Innovation Alliance, the 501(c)3 non-profit behind AgStart. |
Archives
May 2021
Categories |








 RSS Feed