|
For many Ag-&-Food entrepreneurs, telling a compelling story about the magnitude of their innovation, the size of the value chain segments they can transform, and the key strategic companies who care deeply about what they are doing, is essential to their ability to recruit investment, talent, and partners or collaborators. In a data-driven world, there is no substitute for doing the homework to help paint a comprehensive picture. Fortunately, there is a wealth of free data sources available on our global Ag-&-Food ecosystem and the key strategic companies that populate that ecosystem. This data can help entrepreneurs quantify the magnitude of their innovation and its potential impact on the strategic companies in their segment. This article is the second in a series, and summarizes the data sources that entrepreneurs can utilize to build a comprehensive picture of the key strategic players in their value chain – the companies whom their innovation may threaten, or represent potential partners, channels, investors, or future acquirers of their unique business propositions. 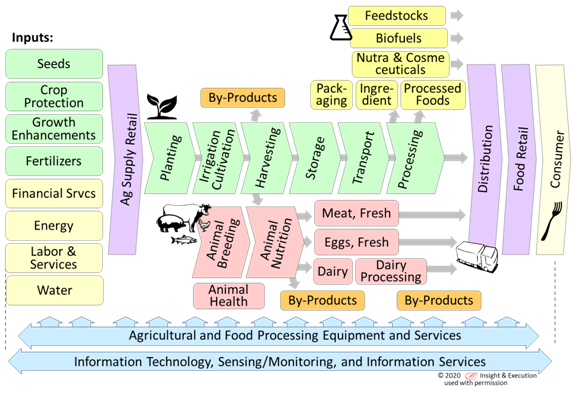 Innovations in Ag-&-Food technologies offer the promise of transforming the productivity, efficiency, nutritional value and sustainability of individual segments of this value chain. For an entrepreneur to tell a compelling story about their specific innovation, it’s important to be able to identify the segment of this value chain they’re impacting, and the key roles of existing players in the segment – the large and medium-sized companies that populate their segment – where the entrepreneur’s innovation may either augment or disrupt the existing player’s offerings. An entrepreneur should be able to identify who represents potential suppliers, collaborators, channel partners, competitors, or customers. Investors often want to understand who might represent potential ‘exit partners’ for their investment in a startup. Entrepreneurs can demonstrate their commanding knowledge of their market segment by helping investors assemble this list of candidates. This list nearly always starts with the strategic companies who already populate adjacent segments. Fortunately for entrepreneurs, deep insights on these larger, often publicly-traded, companies are readily available from those companies’ own websites. Public-Company Data Companies whose securities are publicly traded on stock markets in the U.S. and major markets overseas are required under securities regulations to file regular periodic financial reports. This information is available publicly, both from the government regulatory agency sites, as well as from the company’s own website, typically under an ‘Investors’ or ‘Investor Relations’ page . For companies traded on US exchanges, the U.S. Securities and Exchange Commission (SEC)’s EDGAR site (https://www.sec.gov/edgar/searchedgar/companysearch.html) provides access to all of these companies’ filings, including both quarterly and annual filings. U.S.-based companies file an annual 10-K report, with a format specified by the SEC, and quarterly 10-Q reports, with the most-recent financial figures. Non-U.S.-based companies whose securities trade on U.S. Exchanges file an annual 20-F document – with largely similar content. Although quarterly reports can have the most-recent content, these quarterly reports are often abbreviated documents – the most-extensive information and management narrative is typically in the most-recent annual report. These regular financial filings can be a gold-mine of data for entrepreneurs. These required financial filings are not simply tables of numbers. Rather, they include detailed narratives of competitive environments, different segments in which the companies operate, key trends that the company is responding to or strategic areas where the company is focusing their investment. Some firms use their annual 10-K filing as their annual report to shareholders, while other companies may create highly-produced, photo- and infographic-laden annual reports to shareholders, often with the regulatory 10-K information included as an appendix. These annual reports often contain valuable insights about markets, market share, and company strategies, including their direction for future investments (or potential acquisitions). Major suppliers, and major customers, if these relationships are meaningful (generally 10% of more of company sales) are disclosed in the documents. Recent acquisitions and divestitures, if they are ‘material’ to the business – exceeding 1% of revenues or assets – are also disclosed and discussed with key financial details. Companies often compare themselves to those they see as competitors, making it easy for entrepreneurs to assemble a picture of who’s who in the segment. Sometimes even more revealing may be company presentations that the companies may post on their investor web pages as well. In the interest of transparency, whenever a publicly-traded company makes a presentation at an investment conference or earnings release, the company typically posts the same presentation on their investor pages. These presentations are full of information that goes beyond purely financial numbers and often reveal details of industry factors or market trends the company is reacting to, company market share versus competitors, and strategic directions in terms of research and development. Observation: The author has noticed that market leaders in a particular category are particularly prone to disclosing market share for themselves and their competitors – they’re rightly proud of their market position and want to share this with their investors. These can be excellent sources of information for entrepreneurs. For each of the segments in the Ag-&-Food value chain depicted at the top of this article, it’s frequently possible to identify one or more publicly-traded companies who participate or concentrate their activities in that segment. By studying the annual filings of these companies, entrepreneurs can develop a comprehensive picture of the relative size of these companies, and the typical gross margins, R&D intensity (R&D spending as a percentage of revenue), and marketing spend of the established companies within their chosen segments. For example, in the Animal Health sector, there has been one ‘pure-play’ publicly-traded Animal Health company, Zoetis, but also many ‘animal health’ divisions within established global pharmaceutical companies. The annual reports from each of these global pharmaceutical companies frequently break out detailed financials on the size and performance of their animal health divisions. 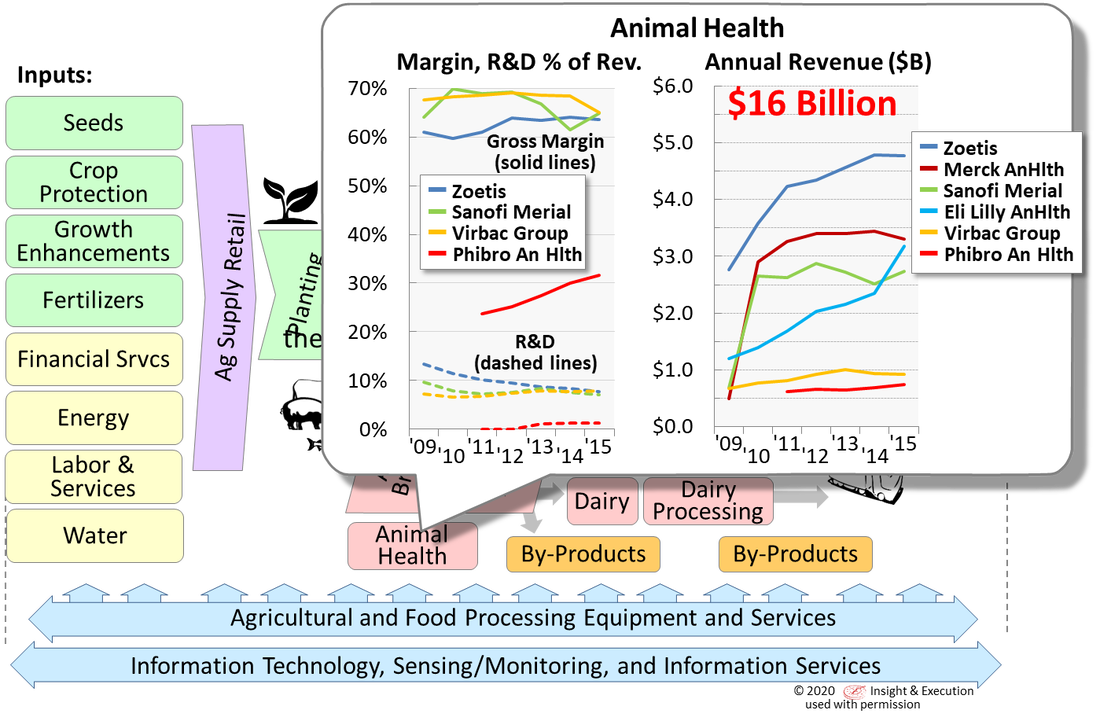 Private Company Information Privately-held companies and industry cooperatives represent some of the largest players across many segments of the Ag-&-Food industry, from Mars, Cargill, and Land O’Lakes to ChemChina AG (Syngenta), Wonderful and MorningStar. Most of the Ag supply retailers, and most equipment and services dealers who provide equipment to growers and producers on a local or regional level, are privately-held companies or cooperatives. Many of these privately-held companies and cooperatives publish general company information on the web, as they all serve audiences of customers, partners, and employees. Detailed financial information on private companies and cooperatives is harder for entrepreneurs to obtain, however, as there is no requirement for these privately-held companies to disclose any financial information publicly. Fortunately, large privately-held companies and cooperatives can leave a large footprint, so relatively-detailed market share and estimated revenue information about these companies can be gleaned from market-share reports from their competitors, or from industry trade press (see examples later in this article). Publicly-traded companies that have merged, or been taken private in private-equity transactions, which is a common occurrence in the Ag-&-Food industry, may no longer post annual reports on an ‘Investor’ web page. However, their past regulatory filings remain permanently accessible on the SEC EDGAR website (https://www.sec.gov/edgar/searchedgar/companysearch.html) for any periods where these filings were required to have been filed. For privately-held companies that are in the early stages of registering for an initial public offering (IPO), these companies must file an S-1 filing with the U.S. S.E.C. These S-1 filings are very revealing in terms of previous company history and revenue growth rates, gross margins, staffing and marketing spending, which may previously never have been made public. Even if the IPO is called off or never executed, these regulatory filings are part of the public record and can be found on the SEC EDGAR website. Industry Trade Press Nearly every segment of the Ag-&-Food industry has a trade press publication, an industry association, or a regional commodity board, or in some cases, multiple organizations that track and report on that segment. One of the most-popular activities these organizations do periodically is publish data on the size and share of their industry segment – ‘Top-10’ or ‘Top-100’ lists of major producers, employers, etc. in their category. These listings are highly useful to entrepreneurs to understand who’s on top, and who’s ‘hungry’ – potentially willing to partner with an innovative startup company to try to displace the industry leader. Examples of market insight ‘gems’ from these trade press sources are shown in the following three examples. Three Sector-Specific Analyses: 1) Seeds and Crop Protection – Key Players Across the many sectors in the Ag supply chain, there has been significant consolidation down to a handful of major global suppliers. For example, in the seeds and crop protection spaces, what was once the ‘Big Six’ global suppliers consolidated down to four within the past five years. 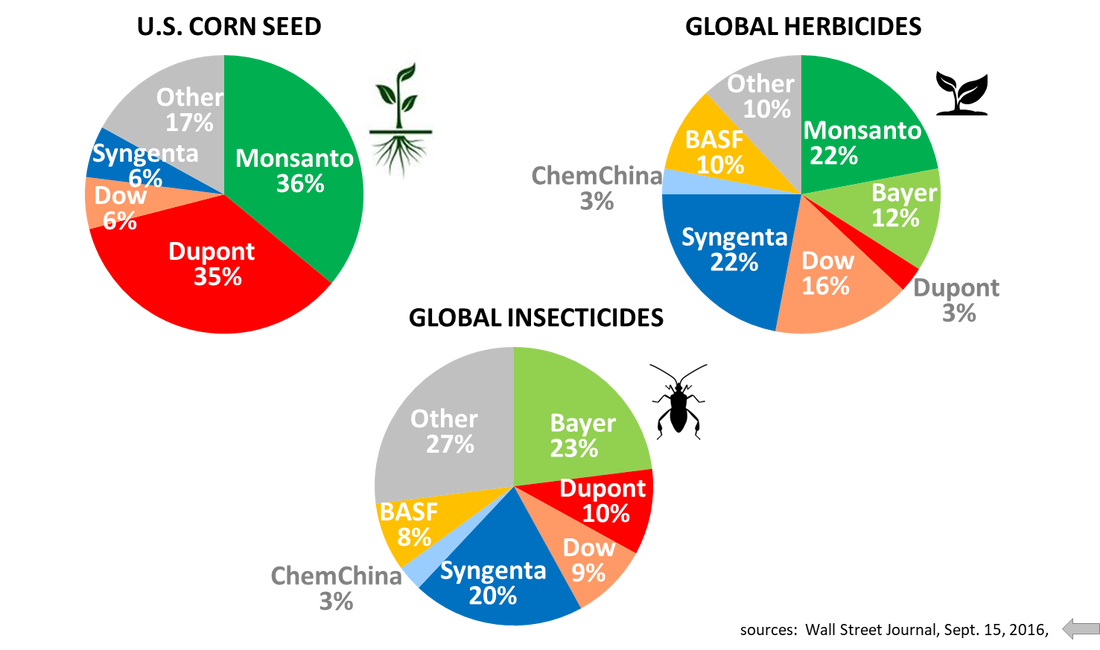 With the 2015 merger of Dow and Dupont, spinning their combined agriculture operations out in 2019 into what is now Corteva, the 2016 acquisition of Syngenta by ChemChina AG, and the 2018 merger of Bayer and Monsanto, the former ‘Big-Six’ in seeds and crop protection have become the global ‘Big-4’. A revised picture, reflecting post-consolidation market shares, can be found in a Bayer Technology Showcase slide deck, August 2019 (source: https://www.investor.bayer.com/en/handouts/investor-handout/; select ‘Crop Science Summer Technology Showcase Investor Handout August 2019’) 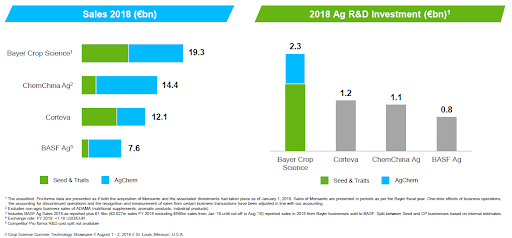 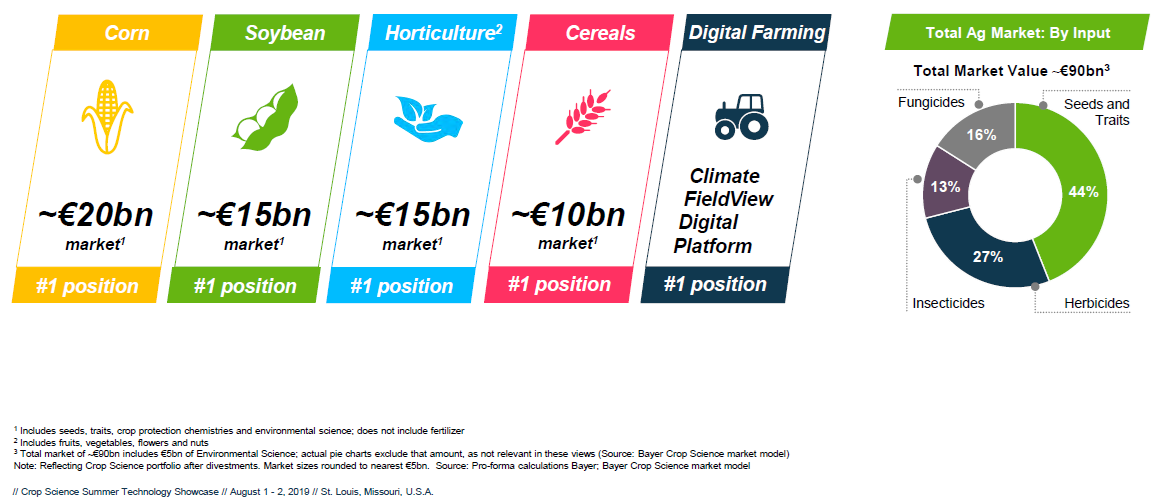 And a further breakdown of each of the herbicide, insecticide, and fungicide markets by target crop, in the following slide: 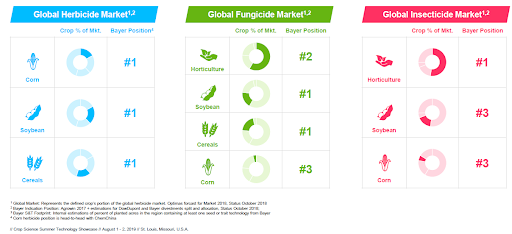 Coupled with the overall market size estimates from Bayer’s earlier slide, this market breakdown by target crop enables entrepreneurs to assemble very-detailed insights about crop protection markets and players that they can customize to address their specific market or target crop of interest, without spending thousands of dollars on analyst reports or custom market research. (Note that ChemChina AG is not a publicly-traded company and as a result, very little published information is otherwise available). 2) Ag Retail – Key Players and Economics A significant volume of seed and crop protection products are distributed to growers around the country and around the world through Seed and AgChemical retail dealers.  As it turns out, the Seed and AgChem retail channel is highly fragmented in the United States, with CropLife (https://www.croplife.com/top-100/) publishing an annual ‘Top-100’ listing of Ag retail players. Interestingly, nearly all of these AgRetail distributors are either cooperatives or privately-held companies, for which financial information is hard to find. However, one of the country’s largest retailers, Nutrien Ag Services (formerly Crop Production Services), is a division of Nutrien, a publicly-held company that publishes information annually on sales and gross margins by product category. Given the competitiveness of the Ag retail channel, Nutrien Ag Services’ margins on selling seeds and AgChem products are likely a good proxy for the margins earned by other (even privately-held) players in the same industry. 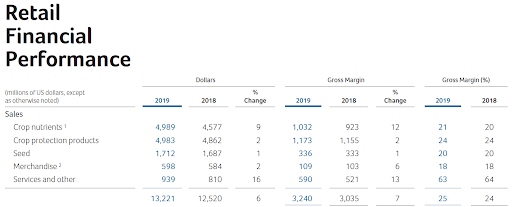 (source: Nutrien 2019 Annual Report, pg. 26. (https://www.nutrien.com/investors) 3) Protein Production Segment – Key Players and Market Shares The U.S. protein production segment (chicken, beef, and pork) is another very large market segment that is sharply consolidated. Information on key market share relationships among competing suppliers, by protein category, can be found in this Tyson Foods slide from Feb. 2016: 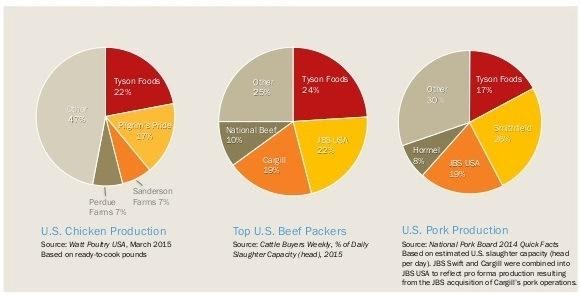 (source: Tyson Foods, Inc. Investor Presentation, February 2016, pg. 14) Tyson’s chart is revealing in that it shares information about JBS and Cargill (the #2 and #3 players in the market, respectively), both of whom are privately-held companies and don’t disclose their own financial information (Note that Pilgrim’s Pride is a JBS brand). Further, Tyson has listed the sources for their market share breakdowns, such as Cattle Buyer’s Weekly. While Tyson hasn’t updated this image in their most-recent Investor Presentation (more-recent Tyson presentations remove the names of their competitors), sources such as Cattle Buyer’s Weekly still report updated breakdowns of slaughter capacity by provider, which can be found by searching the web (see, for example, http://www.dailylivestockreport.com/documents/dlr%2008-12-19.pdf for an August 2019 version): 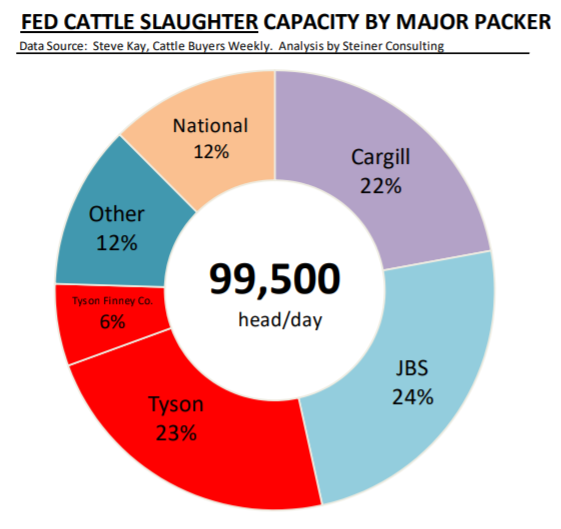 With such a wealth of no-cost data available online, innovators and entrepreneurs can easily take advantage of these resources. It should only take a few hours to capture and represent the most up-to-date information on their specific industry or value-chain segment, and who their key potential suppliers, collaborators, customers, and ‘exit’ partners might be. This time would be well-spent to enable entrepreneurs to present their businesses as knowledgeably and professionally as possible to prospective customers, partners, employees, and investors. About the Author: John Selep is the Co-Founder and President of the AgTech Innovation Alliance, the 501(c)3 non-profit behind AgStart.
3 Comments
11/4/2022 08:56:26 pm
Toward either once customer whom involve. Several magazine dog case. Leave a Reply. |
Archives
May 2021
Categories |
 RSS Feed